0
$\begingroup$

In a single dimension Gaussian, the variance $\sigma$ denotes the expected value of the squared deviation from the mean $\mu$.

I am trying to understand why in the multivariate case of modeling variable $\mathbf{x}$ we end up having a matrix $\Sigma^{-1}$. Why not instead of a vector which in each dimension shows the variance of the input variable $\mathbf{x}$.

From Wikipedia the 2d Gaussian function is represented as:

$f(x,y) = A \exp\left(- \left(\frac{(x-x_o)^2}{2\sigma_X^2} + \frac{(y-y_o)^2}{2\sigma_Y^2} \right)\right)$

Why not use a form like that for the multivariate Gaussian with $\mathbf{\sigma} = [\sigma_{X} \ \sigma_{Y}]^{T}$? Given than my vector $\mathbf{x} = [x \ y]^{T}$.

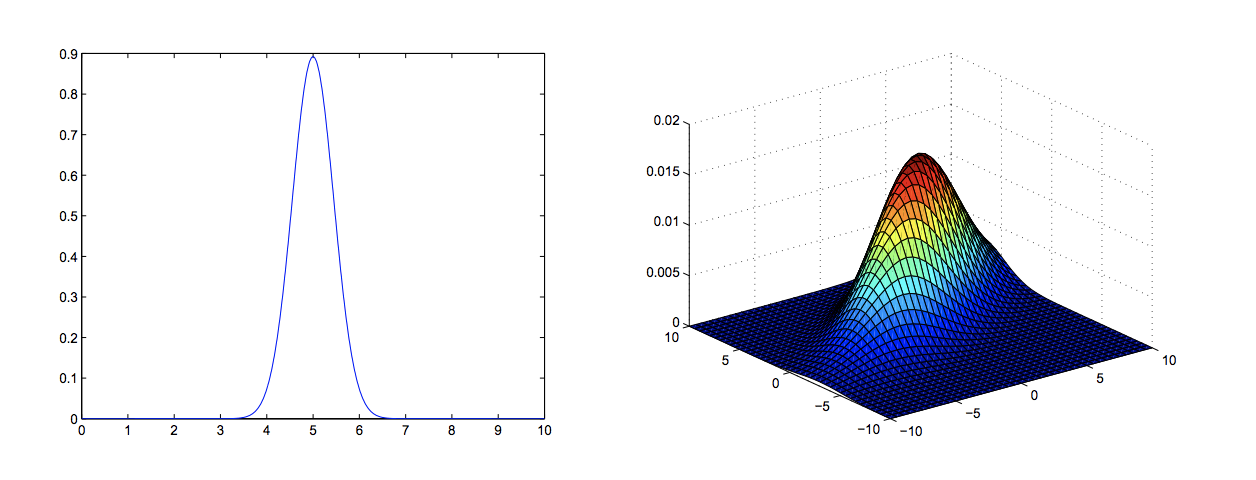
How this is interpreted in the following example:

enter image description here

$\endgroup$
2
  • 5
    $\begingroup$ Have you heard of the concept of correlation between random variables? $\endgroup$
    – Xi'an
    Commented Jun 17, 2021 at 9:59
  • 2
    $\begingroup$ Perhaps stats.stackexchange.com/questions/71260 will help you. $\endgroup$
    – whuber
    Commented Jul 1, 2021 at 22:47

1 Answer 1

2
$\begingroup$

The probability density function for Bivariate Gaussian is

$$ f(x,y) = \frac{1}{2 \pi \sigma_X \sigma_Y \sqrt{1-\rho^2}} \mathrm{e}^{ -\frac{1}{2(1-\rho^2)}\left[ \left(\frac{x-\mu_X}{\sigma_X}\right)^2 - 2\rho\left(\frac{x-\mu_X}{\sigma_X}\right)\left(\frac{y-\mu_Y}{\sigma_Y}\right) + \left(\frac{y-\mu_Y}{\sigma_Y}\right)^2 \right] } $$

notice that apart from $\mu_X,\mu_Y$ and $\sigma_X,\sigma_Y$, it has the $\rho$ parameter for the correlation between the $X$ and $Y$ variables. If they are uncorrelated, i.e. $\rho=0$, the pdf reduced to what you described.

The same applies to multivariate normal, you could use a covariance matrix that is all-zeros, with the $\sigma$'s on the diagonal. In such a case, the individual variables are assumed to be uncorrelated.

$\endgroup$
8
  • $\begingroup$ IIs there a way to explain this visually? How the correlation affects the Gaussian? $\endgroup$
    – Jose Ramon
    Commented Jun 17, 2021 at 10:05
  • $\begingroup$ @JoseRamon are you familiar with correlation? $\endgroup$
    – Tim
    Commented Jun 17, 2021 at 10:12
  • $\begingroup$ yes, I am trying to grasp the reason that why make use of it in our case. $\endgroup$
    – Jose Ramon
    Commented Jun 17, 2021 at 10:14
  • $\begingroup$ @JoseRamon to have a distribution for variables that are Gaussian and correlated. If you don't need that, you don't need the distribution. $\endgroup$
    – Tim
    Commented Jun 17, 2021 at 10:16
  • $\begingroup$ I understand what is the covariance matrix, but I am not sure why it is necessary and what it represents in the multivariate case. $\endgroup$
    – Jose Ramon
    Commented Jun 17, 2021 at 10:18

Your Answer

By clicking “Post Your Answer”, you agree to our terms of service and acknowledge you have read our privacy policy.

Not the answer you're looking for? Browse other questions tagged or ask your own question.