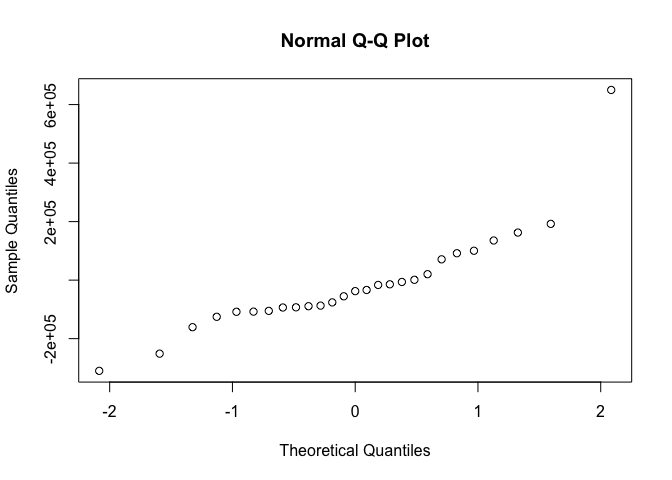
I am analyzing a time series with R version 4.0.4. I have created the ARIMA model for the series and I want to find the distribution of the residuals. Here are the residuals:
residuals <- c(-37583.717, -14253.658, -76085.067, -6305.700, -160826.850,
           100393.749, -105089.547, -108179.481, -55243.708, 162570.953,
           135430.865, -251294.174, 192270.990, -310060.883, -107645.350,
           71062.423, -89140.425, -87112.238, -125336.199, 91926.879,
           649967.685, -92925.131, -16501.053, -93573.476, 1116.598,
           20276.273,  -33654.591)
I created the histogram and calcultated the skewness and kurtosis
hist(residuals)

library(moments)
skewness(residuals) #1.891993
kurtosis(residuals) #8.716795
The histograms, along with the skewness and kurtosis do not suggest that the residuals are normally distributed. However, the results from the Anderson-Darling test suggest that they are in fact normally distributed.
library(goftest)
set.seed(1001)
ad.test(residuals, "pnorm", mean=mean(residuals), sd=sd(residuals), estimated=T)$p.value
The resulting p-value is 0.6197467. Which means that there is not enough evidence to reject the null hypothesis that the residuals are normally distributed.
I am now confused by these conflicting results. What do you think is the distribution? Is the test trustworthy considering that the data consists of only 27 data points?

