I am working with R.
Suppose you have the following data:
    #generate data
    set.seed(123)
    a1 = rnorm(1000,100,10)
    b1 = rnorm(1000,100,10)
    c1 = rnorm(1000,5,1)
    train_data = data.frame(a1,b1,c1)

    #view data
             a1        b1       c1
    1  94.39524  90.04201 4.488396
    2  97.69823  89.60045 5.236938
    3 115.58708  99.82020 4.458411
    4 100.70508  98.67825 6.219228
    5 101.29288  74.50657 5.174136
    6 117.15065 110.40573 4.384732
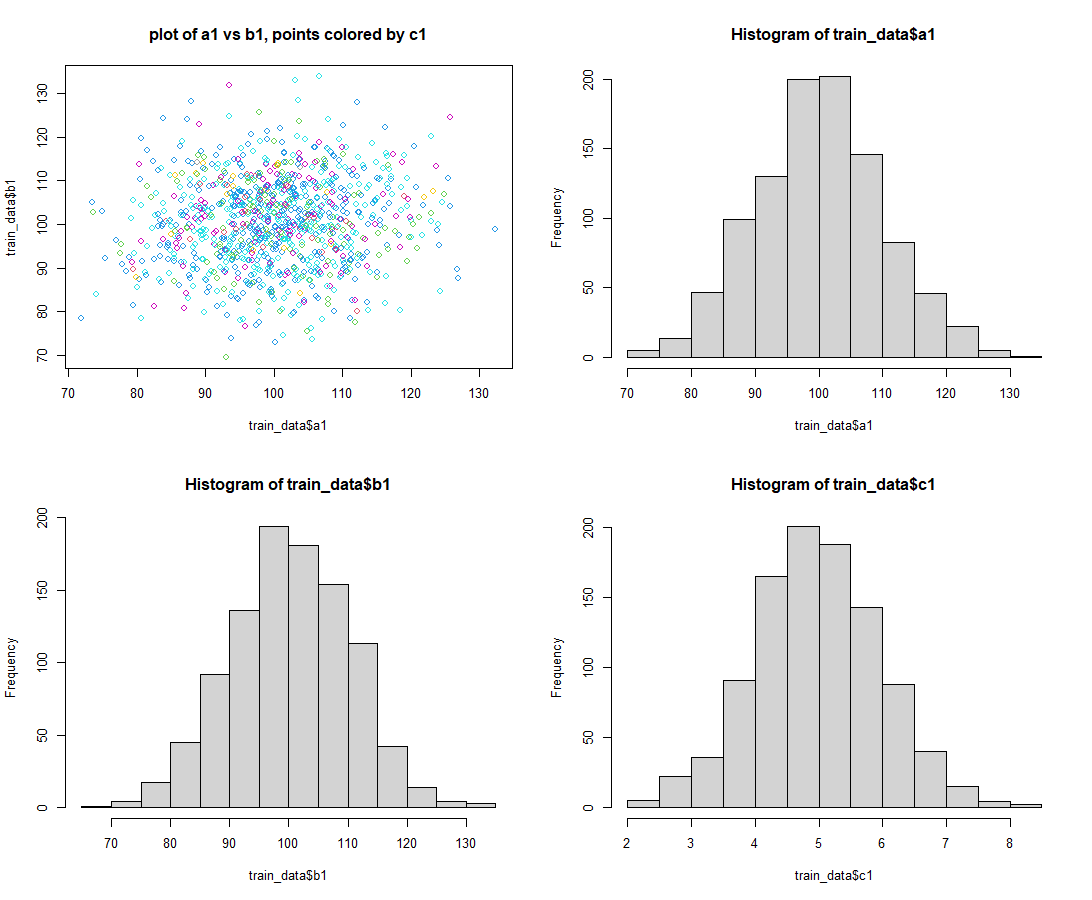
We can visualize the data as follows:
    #visualize data
    par(mfrow=c(2,2))

    plot(train_data$a1, train_data$b1, col = train_data$c1,
       main = "plot of a1 vs b1, points colored by c1")
hist(train_data$a1)
    hist(train_data$b1)
hist(train_data$c1)
Here is the Problem :
From the data, only take variables "a1" and "b1" : using only 2 "logical conditions", split this data into 3 regions (e.g. Region 1 WHERE 20 > a1 >0 AND 0< b1 < 25)
In each region, you want the "average value of c1" within that region to be as small as possible - but each region must have at least some minimum number of data points, e.g. 100 data points (to prevent trivial solutions)
Goal : Is it possible to determine the "boundaries" of these 3 regions that minimizes :
- the mean value of "c1" for region 1
- the mean value of "c1" for region 2
- the mean value of "c1" for region 3
- the average "mean value of c1 for all 3 regions" (i.e. c_avg =
(
region1_c1_avg + region2_c1_avg + region3_c1_avg) / 3)
In the end, for a given combination, you would find the following, e.g. (made up numbers):
- Region 1 : WHERE 20> a1 >0 AND 0 < b1 < 25 ; region1_c1_avg = 4
- Region 2 : WHERE 50> a1 >20 AND 25 < b1 < 60 ; region2_c1_avg = 2.9
- Region 3 : WHERE a1>50 AND b1 > 60 ; region3_c1_avg = 1.9
- c_avg = (4 + 2.9 + 1.9) / 3 = 2.93
And hope that (region1_c1_avg, region2_c1_avg, region3_c1_avg and c_avg) are minimized
My Question:
Does this kind of problem have an "exact solution"? The only thing I can think of is performing a "random search" that considers many different definitions of (Region 1, Region 2 and Region 3) and compares the corresponding values of (region1_c1_avg, region2_c1_avg, region3_c1_avg and c_avg), until a minimum value is found. Is this an application of linear programming or multi-objective optimization (e.g. genetic algorithm)? Has anyone worked on something like this before?
I have done a lot of research and haven't found a similar problem like this. I decided to formulate this problem as a "multi-objective constrained optimization problem", and figured out how to implement algorithms like "random search" and "genetic algorithm". Can someone please confirm if my general approach to this problem makes sense?
Note 1: In the context of multi-objective optimization, for a given set of definitions of (Region1, Region2 and Region3): to collectively compare whether a set of values for (region1_c1_avg, region2_c1_avg, region3_c1_avg and c_avg) are satisfactory, the concept of "Pareto Optimality" (https://en.wikipedia.org/wiki/Multi-objective_optimization#Visualization_of_the_Pareto_front) is often used to make comparisons between different sets of {(Region1, Region2 and Region3) and (region1_c1_avg, region2_c1_avg, region3_c1_avg and c_avg)}
Note 2 : Ultimately, these 3 Regions can defined by any set of 4 numbers. If each of these 4 numbers can be between "0 and 100", and through 0.1 increments (e.g. 12, 12.1, 12.2, 12.3, etc) : this means that there exists 1000 ^ 4 = 1 e^12 possible solutions (roughly 1 trillion) to compare. There are simply far too many solutions to individually verify and compare. I am thinking that a mathematical based search/optimization problem can be used to strategically search for an optimal solution.

