12
$\begingroup$

Watching Why You Should Want Driverless Cars On Roads Now, at 8:14 Derek Muller claims:

Surveys show 74 % of people believe they are above average drivers.

This claim motivates my question, but some clarification is needed. I am not asking for someone to source out the statistic nor to address the empirical claim. Rather, I would like a concrete and simple example of my intuition that it is mathematically possible. I've put together a wish list of additional criteria:

  • Has a 'clean' algebraic expression for its probability density function or probability mass function (i.e. not just a constructed dataset or a 'tortured piecewise function')
  • Support is single-variable
  • Support is continuous or contiguous
  • If support is discrete, each bin with nonzero probability mass must have one or two adjacent bins with nonzero probability mass
  • Distribution is unimodal
$\endgroup$
14
  • 3
    $\begingroup$ Related examples on left-skewed distributions. It does not directly answer your question and hence a comment. $\endgroup$
    – B.Liu
    Commented Jul 23, 2021 at 19:21
  • 11
    $\begingroup$ This question is predicated on the implicit assumption that driving ability can be evaluated on an interval scale. I believe most people making and reading statements like the quotation recognize this would be an oversimplification of a complex, multi-attribute characteristic, and thereby understand "average" in a fuzzy sense closer to the median according to some hypothetical ranking. People, after all, are capable of comparing themselves to their neighbors and must be invoking the memories of such comparisons when responding to surveys. I doubt anyone thinks in terms of an arithmetic mean! $\endgroup$
    – whuber
    Commented Jul 23, 2021 at 19:41
  • 2
    $\begingroup$ @whuber "This question is predicated on the implicit assumption that driving ability can be evaluated on an interval scale." No, it isn't. You're adding more of the video's context than what is actually being asked. That being said, you provide a relevant discussion for those interested in the original driving context. $\endgroup$
    – Galen
    Commented Jul 23, 2021 at 19:55
  • 2
    $\begingroup$ @whuber I was suggesting you've added information from the video's context, not to the video's context, which can happen transitively through your reading of the quote from the video even if you didn't observe the video directly. The consideration of what type of variable driving ability would be is beyond the scope of this question. Means require interval scales, but not all interval scales are driving ability. I've tried to clarify that the empirical claim is not pertinent. $\endgroup$
    – Galen
    Commented Jul 23, 2021 at 21:09
  • 4
    $\begingroup$ Whuber is correct. The word "average" in Derek's video does not mean "mean". It means "median". Your question has an answer of course, but since you were motivated by the video I think it's important to stress this confusion $\endgroup$
    – Thanassis
    Commented Jul 25, 2021 at 11:39

6 Answers 6

20
$\begingroup$

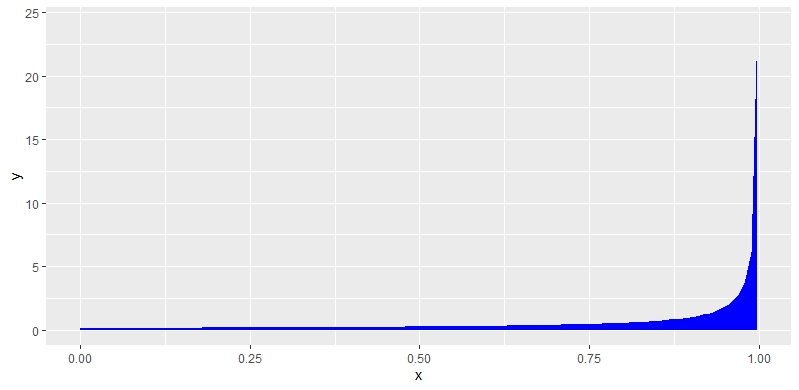
A beta distribution should satisfy your criteria. With first shape parameter of 1.0 and second shape parameter of 0.14, the average is 0.8772 while 74.56 % of the probability is concentrated above that.

Here is a graph of the pdf: R plot of beta pdf

$\endgroup$
6
  • $\begingroup$ Presumably the parameters can be tweaked to obtain exactly 74%. Close enough, but feel free to revise the example to precisely match 74%. $\endgroup$
    – Galen
    Commented Jul 23, 2021 at 19:59
  • 3
    $\begingroup$ I have gotten quite close ($74.00025\%$) with $\alpha = 0.9999052$ and $\beta = 0.1462295$. $\endgroup$
    – Dave
    Commented Jul 23, 2021 at 20:13
  • 3
    $\begingroup$ I've found a similar combination (74.00000000 %) with $\alpha=1.0$ and $\beta=0.146238255.$ $\endgroup$
    – soakley
    Commented Jul 23, 2021 at 20:18
  • 1
    $\begingroup$ @soakley I bet "somewhere" there's a "reverse beta" function (or at least a series expansion) that could converge to the desired value :-) $\endgroup$ Commented Jul 26, 2021 at 12:48
  • $\begingroup$ @CarlWitthoft Indeed there is, see functions.wolfram.com/GammaBetaErf/InverseBetaRegularized for some properties of this inverse function. $\endgroup$ Commented Sep 30, 2021 at 16:40
21
$\begingroup$

The existing answer seems to meet all the requirements in your wish list. For completeness, I just thought I'd add an extremely simple case matching the main requirement, without using continuity, etc. This example does not meet your criteria, but it is added to show that it is extremely easy to get distributions that meet the main requirement (which may be counter-intuitive to some readers).


Example: If $X \sim \text{Bern}(\theta)$ with non-degenerate parameter $0<\theta<1$ you get:

$$\mathbb{P}(X > \mathbb{E}(X)) = \mathbb{P}(X > \theta) = \mathbb{P}(X = 1) = \theta.$$

Taking $\theta = 0.74$ then gives you the required outcome $\mathbb{P}(X > \mathbb{E}(X)) = 0.74$.

$\endgroup$
1
  • 8
    $\begingroup$ A beta distribution with both parameters very small and in the right ratio (roughly $\alpha = 0.74\epsilon, \beta = 0.26\epsilon$, with $\epsilon$ small) is essentially your answer but is technically continuous. $\endgroup$ Commented Jul 24, 2021 at 14:27
4
$\begingroup$

This is possible if there are very large outliers.

In general, if a distribution has outliers with values that are extremely different from the values of the rest of the distribution, then you are likely to have a mean significantly different from the median value.

So, for instance, a distribution of [-1000, 1, 2, 3] would have a median value of 1.5, a mean value of -248.5, and 75 percent of its distribution would be above the mean value.

$\endgroup$
3
  • 1
    $\begingroup$ Your point about sufficiently large outliers is correct, however it doesn't meet the requirements of the question. For example, $[-1000, 1, 2, 3]$ is a constructed data set. $\endgroup$
    – Galen
    Commented Jul 25, 2021 at 15:14
  • 1
    $\begingroup$ I was thinking an example would be expected returns for someone selling lottery tickets. So the majority of the distribution would be +1 (dollars or whatever the cost of a ticket), but then you have that one -1,000,000 winner. (That won't be exactly 74% above the mean, but very tough to get that exact in real data.) $\endgroup$
    – Andy W
    Commented Jul 26, 2021 at 13:27
  • $\begingroup$ @AndyW In the UK, chances for getting three numbers right and winning £10 are about one in 50. About 98% buying a single ticket create profit, 2% create a loss. $\endgroup$
    – gnasher729
    Commented Jul 26, 2021 at 14:18
3
$\begingroup$

The probability of being below the mean for a Poisson distribution with $\lambda=1$ is $73.57$6%. So it shouldn't be hard to imagine a continuous distribution that gets that number over $74$% (you asked for above the mean, but that can be solved with a simple transformation). Pareto distributions can easily have more than $74$% of the probability mass on one side of the mean. For instance, $x_m=2, \alpha = 1$ gives $75$% below the mean.

$\endgroup$
3
$\begingroup$

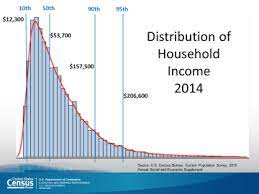
Consider household income distribution in the United States. The mean for that distribution is about $72K, which is much larger than the median. You can estimate what fraction of the distribution is less than the mean from this image. If it's not as much as 75% you can skew it as much as you like by adding a few more high earners.

enter image description here

https://www.census.gov/library/visualizations/2015/demo/distribution-of-household-income--2014.html

$\endgroup$
3
$\begingroup$

A simple real world example would be the number of legs that people have. The huge majority have two legs, nobody has three legs, some few people have one leg or none. The average is just below 2, and the huge majority is a tiny bit above average.

The opposite: Number of citizenships that people have. The huge majority have one, a very small number have none, and a bit more have two or more. The average is just a bit over 1, and the huge majority is below average.

Profit from a risk-only life insurance for the insurance company: If you pay for a life insurance that pays on death only, there will be no payout for most people, with a small profit for the insurance company. A small number create a huge loss. So the majority will create much higher than average profit. This is the situation from another answer, with huge negative outliers, only with a real example.

$\endgroup$

Your Answer

By clicking “Post Your Answer”, you agree to our terms of service and acknowledge you have read our privacy policy.

Not the answer you're looking for? Browse other questions tagged or ask your own question.