I have trouble interpreting my result for my mixed-effect linear regression. I don't if the result are relevant, can someone help me?
After testing different formula for a mixed-effect linear regression using AIC, I choose this one. M1<-lmer(A.Moveis~D.utilizador+(1|Zona),data=d). Where "A.Moveis" is the abundance of mobile species ; "D.utilizador" is the density of humans ; and "Zona" is the factor of the different zones in the study area.
Summary M1 gave me :
Formula: A.Moveis ~ D.utilizador + (1 | Zona)
   Data: d

REML criterion at convergence: 234.9

Scaled residuals:
    Min      1Q  Median      3Q     Max
-1.3060 -0.7123 -0.2464  0.5910  2.5700

Random effects:
 Groups   Name        Variance Std.Dev.
 Zona     (Intercept)   8.565   2.927
 Residual             127.204  11.278
Number of obs: 32, groups:  Zona, 4

Fixed effects:
             Estimate Std. Error t value
(Intercept)    14.158      3.511   4.032
D.utilizador  -16.255     13.800  -1.178

Correlation of Fixed Effects:
            (Intr)
D.utilizadr -0.710
And this table :
                         Dependent variable:
                    -----------------------------
                              A.Moveis
-------------------------------------------------
D.utilizador                   -16.255
                              (13.800)

Constant                      14.158***
                               (3.511)

-------------------------------------------------
Observations                     32
Log Likelihood                -117.433
Akaike Inf. Crit.              242.865
Bayesian Inf. Crit.            248.728
=================================================
Note:               *p<0.05; **p<0.01; ***p<0.001
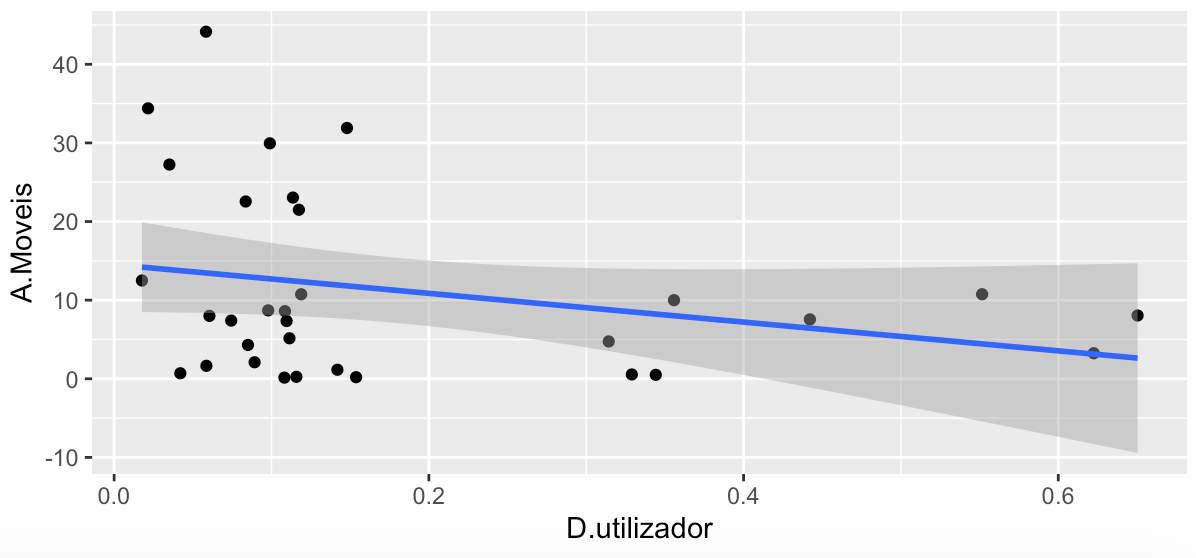
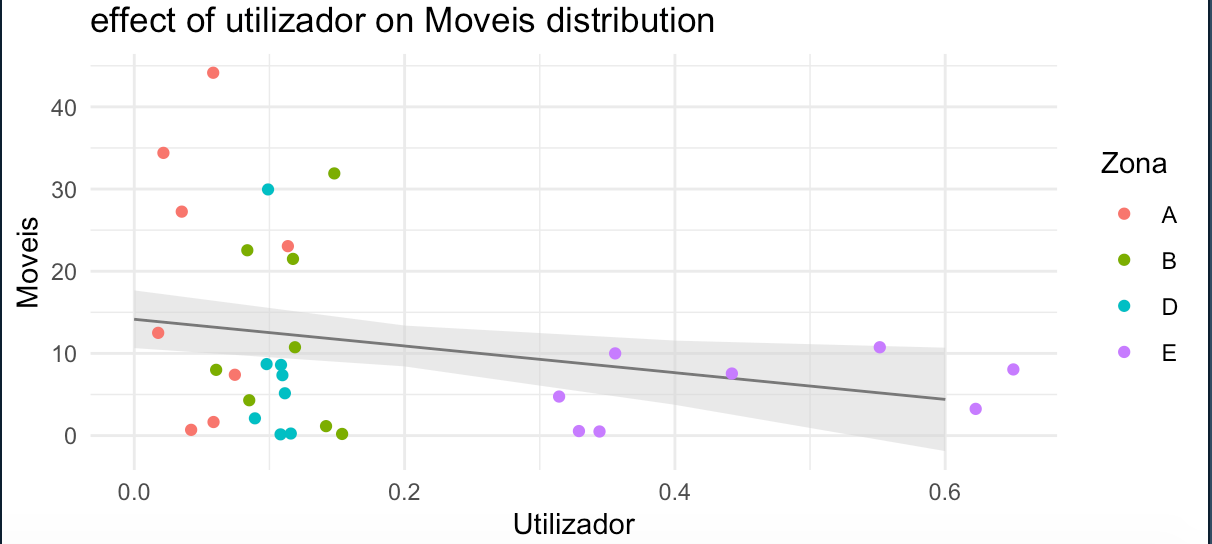
The graph showed a decreasing slope, but I don’t know how to interpret the results here. Is the relation between species abundance and human density is significant? What does it mean that the constant is significant?
I also did an adonis test :
adonis(formula = A.Moveis ~ D.utilizador + (1/Zona), data = d,      permutations = 999, method = "gower")

Permutation: free
Number of permutations: 999

Terms added sequentially (first to last)

             Df   SumsOfSqs  MeanSqs  F.Model      R2        Pr(>F)
D.utilizador  1    0.16368   0.16368   2.3979   0.07401      0.142
Residuals    30    2.04779   0.06826            0.92599
Total        31   2.21147                       1.00000
The R2 residual is really high, I don’t know if it means that my model is not good?
Here's the graph. the second one is a prediction plot.

Is there a more suitable method than a mixed-effect linear regression?
Thank you in advance for you help.
Thank you very much for your answer.
Indeed I don't have a lot of observation... In reality it is an analysis based on 10 years of data. But for the species data and the frequentation data to match I had to gather them by year and by area. So that makes only 32 observations...
You can interpret the effeect size as: each 1 unit change in D.utilizador is associated with a 16.255 change in A.Moveis, in the oppostie direction.
Thank you !!
It means that, if the intercept is atually zero, the probability of observing the data that you did observed (or data more extreme) is lower than some pre-defined threshold (often 0.05)
Ok, so it makes sense I think
I doubt it because 4 groups is insufficient for any mixed effects model fitted with lme4 or any other frequentist mixed model package. 32 is likely to be too small also as a total sample size.
Do you know if an other model could be more efficient? Maybe a signe linear regression?

