0
$\begingroup$

I feel like I am missing a key link and this tasks is quite easy: I am given the following averages and standard deviations:

$\bar{x}_1 = 971$, $s_1 = 42$, $n_1 = 1000$

$\bar{x}_2 = 983.9$, $s_2 = 60.18$, $n_2 = 10$

For the second dataset, I have all observations.

What is an appropriate test to check whether $\sigma_1$ is larger than $\sigma_2$? Of course I stumbled upon the F-Test, but as far as I understood it, it can only handle testing whether variances are equal or not; not whether one is larger than the other. A friend of mine used Chi-Square, but I do not see how Chi-Square would be applicable here.

Thank you and best Paul

$\endgroup$
1
  • 1
    $\begingroup$ How would you do the F-test to check if the two variances are equal? // Did you know up front that you should be checking that $\sigma_2>\sigma_1$, or did you base that on the fact that $s_2 > s_1?$ (You wrote that you are to check if $\sigma_1 > \sigma_2$, but I assume you meant the reverse.) // You might be in a part of your course where you always assume everything is normal, but the F-test can have awful performance when that assumption is violated. $\endgroup$
    – Dave
    Commented Jul 28, 2021 at 20:18

1 Answer 1

1
$\begingroup$

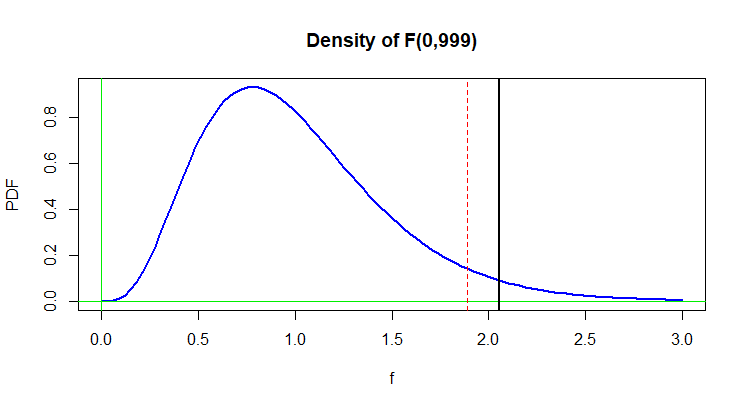
Assuming normal data, under $H_0: \sigma_2^2/\sigma_1^2, $ the ratio $F =s_2^2/s_1^2 = 60.18^2/42^2 = 2.053 \sim \mathsf{F}(9,999).$

For a one-sided test against $H_a: \sigma_2^2/\sigma_1^2 >1,$ one rejects if the F-statistic exceeds the the 95th percentile $1.8892$ of $\mathsf{F}(9,999),$ called the critical value. So you do (just barely) reject at the 5% level of significance. [For a two-sided test against $H_a: \sigma_2^2/\sigma_1^2$ the critical values would be at $0.299$ and $2.126,$ so you would not reject against the 2-sided alternative at the 5% level.]

qf(0.95,9,999)
[1] 1.889236

qf(c(.025,0.975),9,999)
[1] 0.299400 2.126391

In terms of P-values, the P-value for the 1-sided test is $0.031 < 0.05 = 5\%$ so you'd reject at the 5% level. [The P-value of the 2-sided test would be double the P-value of the 1-sided test.]

1 - pf(2.053, 9, 999) 
[1] 0.0310929

The figure below shows the density function of $\mathsf{F}(9,999)$ along with the observed value of $F$ (solid black vertical line) and the one-sided critical value (dotted red).
enter image description here

Note: Traditionally, the larger sample variance is put in the numerator of the F-statistic because many printed tables of F distributions do not give lower tail probabilities. (Of course, most software programs give probabilities in both tails.)

$\endgroup$

Your Answer

By clicking “Post Your Answer”, you agree to our terms of service and acknowledge you have read our privacy policy.

Not the answer you're looking for? Browse other questions tagged or ask your own question.