4
$\begingroup$

I have an experimental data set in which each subject experienced 2 trial types (call them "control" vs "experimental") and 8 trials within each type. Each trial is associated with a single response measurement (call it "output").

My current linear mixed model includes the fixed effect of trial type, the fixed effect of trial number (i.e. chronological order), the interaction of the two, the random effect of individual intercepts, the random effect of individual by trial type (i.e. individual differences in the effect of trial type on "output"), and the random effect of individual by trial number (i.e. individual differences in slope with respect to trial number). The R syntax I am using is:

Model <- lmer(output ~ Trial_Number + Trial_Type + Trial_Number:Trial_Type + (1|Subject) + (0 + Trial_Type|Subject) + (0 + Trial_Number|Subject), data = MyData)

What I would LIKE to do is estimate the random slopes term for trial number SEPARATELY for each trial type (control vs. experimental). Based on what I've looked up on my own, I think it should look something like the following:

Model <- lmer(output ~ Trial_Number + Trial_Type + Trial_Number:Trial_Type + (1|Subject) + (0 + Trial_Type|Subject) + (0 + Trial_Number|Trial_Type/Subject), data = MyData)

...but I am not sure because I couldn't find an example that was exactly parallel to my setup. Will this code accomplish what I am trying to do? Thanks in advance for any advice!!


EDIT (based on Robert Long's comment)

Here is a link to a portion of my data: https://docs.google.com/spreadsheets/d/121_IWJAJJg6X-SpD5Egqh7JBbTi4Byb8L0fPgtQ-mdI/edit?usp=sharing

For the fixed effects: I expect that output values for the experimental trials will on average be larger than for the control trials (main effect of trial type). I also expect that output values will generally decrease with increasing trial number (main effect of trial number). Finally, I expect that the slopes with respect to trial number will be steeper for the experimental trials than for the control trials (interaction effect). [note: I left this interaction effect out of the original post, and have modified the above text/models to include it.]

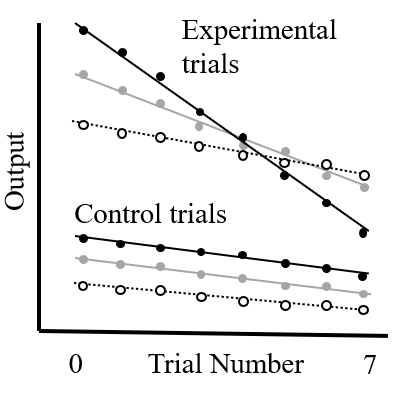
For the random effects: I expect that individual subjects will have different average levels of the output variable (random individual intercepts), as well as different changes in response to the experimental treatment (random effect of individual by trial type). The tricky part is the individual differences in slope with respect to trial number, because I expect (and would like to demonstrate statistically) that these will look markedly different for the control trials as opposed to the experimental trials. I've included a simplified theoretical figure (not from my real data!) illustrating what I expect to see (different colors represent different individuals, each point is a measurement of the output, and each line is a trendline):

enter image description here

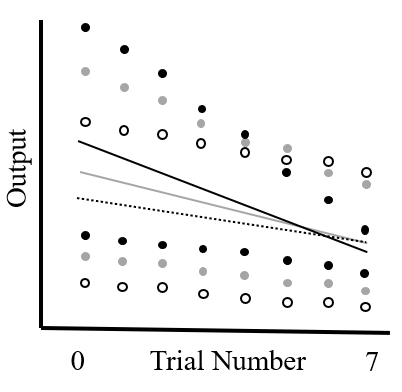
Calculating the random effect of individual by trial number without grouping the trials by experimental vs. control would demonstrate the variance among individuals' average slopes w/respect to trial number (as shown in the figure below), but I'm much more interested in looking at the differences between the experimental and control trials. Is it not possible to look at the main effect of Trial Type and its effect on among-individual slope variance (w/respect to Trial Number) in the same model?

enter image description here

Thanks so much for your help!!

$\endgroup$
2
  • 2
    $\begingroup$ The proposed model does not make sense. For one thing, you have fixed effects for Trial_Type yet you also specify Trial_Type as part of the grouping factor Trial_Type:Subject. This does not make sense. Please can you edit the question and include either a link to the data (ideally) or a sample of data with the same structure. I think what you want can be achieved with dummy variables, but it's quite tricky. $\endgroup$ Commented Aug 17, 2021 at 19:03
  • $\begingroup$ Thanks so much for your help! I've edited the question as requested @RobertLong $\endgroup$
    – Allison M
    Commented Aug 17, 2021 at 22:33

1 Answer 1

3
$\begingroup$

The most general form of allowing variances among subjects to differ among trial types is to include a dummy variable that includes/excludes an additional variance term for some components of the model. This admittedly slightly hacky approach will only work if the 'baseline' level is the one with lower variance. Something like:

(1 + Trial_Type + Trial_Number | Subject) +
   (0 + dummy(Trial_type, "experimental") + 
        dummy(Trial_type, "experimental"):Trial_Number | Subject)

will add additional (correlated) variance components for the among-subject variation in intercept and slope with respect to trial number that only apply to subjects in the experimental treatment. The reason this works is that the dummy variable is a numeric indicator variable that gets multiplied by the random effect variable, zeroing it out where it's not wanted.

I think the second term could be written slightly more compactly as

(0 + dummy(Trial_type, "experimental")/Trial_Number | Subject)

(or even more compactly if you defined something like MyData$d_exp <- dummy(My_Data$Trial_type, "experimental") up front ...)


As a side point, are you fitting

(1|Subject) + (0 + Trial_Type|Subject) + (0 + Trial_Number|Subject)

(or equivalently (1 + Trial_Type + Trial_Number || Subject))

rather than

(1 + Trial_Type + Trial_Number | Subject)

(1) intentionally, because you want the terms associated with Subject to be independent of each other, (2) for parsimony/to avoid singular fits, (3) because you're not aware of the difference?

$\endgroup$
5
  • $\begingroup$ Thanks for the input, I'll explore the dummy variable route a bit! W/regards to your side point, I intentionally wrote the two random slopes and the random intercept to be independent of one another... but I probably don't understand the difference/implications quite as deeply as I should. I was considering looking for slope-intercept correlations later on, but hadn't thought about correlations between the two slopes and what those might mean. If I write them as non-independent, does R give estimates of the correlations, or does it just build additional assumptions into the model? Thanks!! $\endgroup$
    – Allison M
    Commented Aug 18, 2021 at 0:57
  • 1
    $\begingroup$ It estimates the correlations (but this can be hard with a limited data set). Take a look at the Barr et al. "Keep it maximal" paper ... $\endgroup$
    – Ben Bolker
    Commented Aug 18, 2021 at 0:59
  • 1
    $\begingroup$ If reading Barr et at 2013 please also read Bates et al 2015 "Parsimonious Mixed Models". $\endgroup$ Commented Aug 18, 2021 at 4:34
  • $\begingroup$ After talking to my PhD advisor about it, I don't think the dummy variable code as written is doing quite what I want. He was able to do it in SAS fairly simply using the following code: "Output = Trial_Number | Trial_Type Random Intercept Trial_Type / Subject = SubjectID Random Trial_Number / Subject = SubjectID Group = Trial_Type" (I may have copied/formatted some of that slightly wrong since I'm unfamiliar with SAS!). $\endgroup$
    – Allison M
    Commented Nov 12, 2021 at 16:53
  • $\begingroup$ (Continued from above) I was able to get results SIMILAR to what he got from SAS using the following R code: "Output ~ Trial_Number + Trial_Type + Trial_Number:Trial_Type + (1 + Trial_Type|SubjectID) + (0 + dummy(Trial_Type, "Experimental"):Trial_Number | SubjectID) + (0 + dummy(TrialType, "Control"):Trial_Number | SubjectID)" However, I'm not sure if this R code is valid/makes sense. I would welcome any comments or suggestions for if/how to modify it! Thanks so much for your input! $\endgroup$
    – Allison M
    Commented Nov 12, 2021 at 17:00

Your Answer

By clicking “Post Your Answer”, you agree to our terms of service and acknowledge you have read our privacy policy.

Not the answer you're looking for? Browse other questions tagged or ask your own question.