0
$\begingroup$

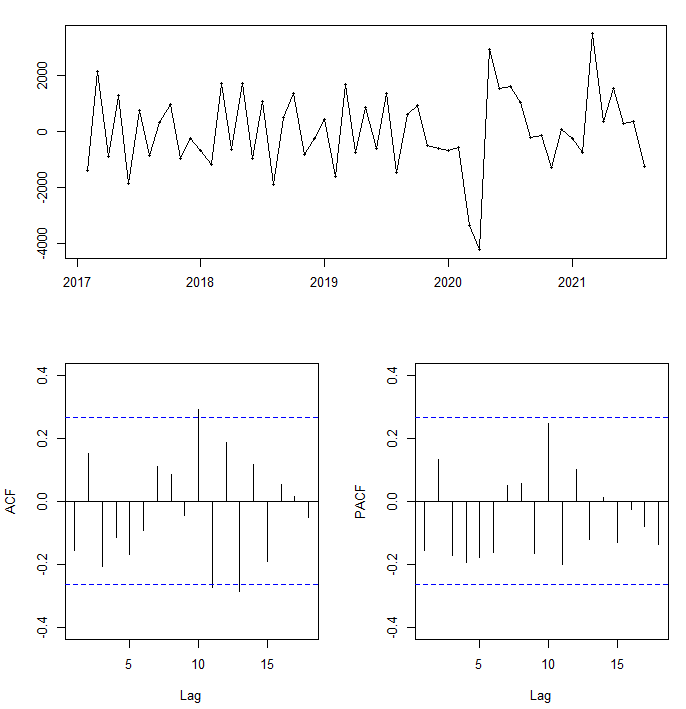
I have been fussing over the ACF and PACF plots with 1 order of differencing (passed the ADF test) but I haven't found any information that deals with ACF and PACF plots that have lags as large as mine or data as irregular as mine.

From Hyndman's textbook I gather that the PACF plot is decaying towards zero and the ACF plot is last significant at lag 13. So would this result in an ARIMA(0,1,13) model?

auto.arima is producing vastly different results and I am confused about what path forward is the right path to take given the unusualness of the time-series.

enter image description here

$\endgroup$
1
  • $\begingroup$ What do you think about my answer? If it is helpful and clear, you may accept it by clicking on the tick mark to the left. Otherwise, you may ask for further clarification. This is how Cross Validated works. $\endgroup$ Commented Jan 12, 2022 at 15:55

1 Answer 1

2
$\begingroup$

Your series does not appear unusual to me. It looks more or less like white noise. If you were to simulate some i.i.d. data and plot them and their ACF & PACF, you would get a similar set of pictures.

If the plots are of the first differences of the original series, then the original series is likely a random walk (which is a cumulative sum of an i.i.d. series).

$\endgroup$

Your Answer

By clicking “Post Your Answer”, you agree to our terms of service and acknowledge you have read our privacy policy.

Not the answer you're looking for? Browse other questions tagged or ask your own question.