4
$\begingroup$

The aim of my study is to study the differences between stages of sleep based on the proportion of response when subjects are faced with some stimuli. To begin with I used a classical frequentist approach by fitting a linear mixed model (function lmer in R) with "Sleep_Stages" as the fixed factor and "Subject" as the random factor:

model<-lmer(Response~Sleep_Stages+(1|Subject),data)

I studied the pairwise comparisons and realised that the difference between two groups(Stage2 and Stage5) is not significant:

       contrast     estimate     SE     df t.ratio p.value
 Stage2- Stage5       0.074 0.0520 109716   1.187  0.4486

This result is very interesting to me, but I can't just conclude that since there is no significant difference between Stage2 and Stage5 that means that Stage2 is equivalent to Stage5, that simply means that the current evidence is not strong enough to persuade me that the two groups lead to different outcomes ("the absence of evidence is not the evidence of absence")... In another word I am not trying to prove that one group makes a statistically significant difference in the outcome. Rather, I am trying to prove that the two groups are essentially equivalent, I've been advice to use an equivalence test using TOST procedure:

m1<-mean(Stage2)
sd1<-sd(Stage2)
n1<-length(Stage2)
m2<-mean(Stage5)
sd2<-sd(Stage5)
n2<-length(Stage5)

library(TOSTER)
> TOSTtwo(m1,m2,sd1,sd2,n1,n2,low_eqbound_d=-1.5,high_eqbound_d=1.5)

TOST results:
t-value lower bound: 5.69   p-value lower bound: 0.000001
t-value upper bound: -3.87  p-value upper bound: 0.0002
degrees of freedom : 32.82

Equivalence bounds (Cohen's d):
low eqbound: -1.5 
high eqbound: 1.5

Equivalence bounds (raw scores):
low eqbound: -0.3946 
high eqbound: 0.3946

TOST confidence interval:
lower bound 90% CI: -0.065
upper bound 90% CI:  0.215

NHST confidence interval:
lower bound 95% CI: -0.093
upper bound 95% CI:  0.243

Equivalence Test Result:
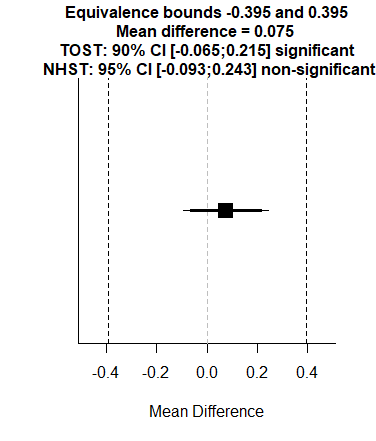
The equivalence test was significant, t(32.82) = -3.873, p = 0.000242, given equivalence bounds of -0.395 and 0.395 (on a raw scale) and an alpha of 0.05.

Null Hypothesis Test Result:
The null hypothesis test was non-significant, t(32.82) = 0.909, p = 0.370, given an alpha of 0.05.

Based on the equivalence test and the null-hypothesis test combined, we can conclude that the observed effect is statistically not different from zero and statistically equivalent to zero.

enter image description here

So could I conclude now that I have a substantial evidence that the two groups (Stage2 and Stage5) are equivalent?

Can someone help me interpret this results?

(PS: I don't really know how to choose the equivalence bounds..)

$\endgroup$

1 Answer 1

3
$\begingroup$

$1\text{st}$

(PS: I don't really know how to choose the equivalence bounds..)
The good news is that this is not really a statistics question. This is a matter of what your customer (loosely speaking) regards as "close enough" to zero for the difference to be acceptable. The bad news is that, if you customer will not say, you need to use your own knowledge of the subject matter to decide this or bring in a subject matter expert to help you decide it.

If you cannot determine what constitutes equivalence bounds, it is reasonable to question if equivalence testing is an appropriate method for your work.

$2\text{nd}$

You have set your equivalence bounds as $\pm 0.395$. One one-sided test of the TOST procedure says that the difference is no greater than $0.395$, so the difference must be less. The other one-sided test of the TOST procedure says that the difference is no less that $-0.395$, so the difference must be greater. Consequently, these tests together say that the difference is between $-0.395$ and $+0.395$. It seems that your equivalence test was a success!

The NHST result seems to be testing if the difference is nonzero. However, such a test aligns with your "the absence of evidence is not the evidence of absence" line and is not of interest to showing equivalence (maybe if you have done a power calculation).

Your TOST and NHST result can coexist. TOST says that the difference is between $-0.395$ and $+0.395$, while the NHST says that the difference is not zero. Since the plot shows the difference to be about $0.07$, these results are totally compatible.

$\endgroup$
1
  • 1
    $\begingroup$ " The bad news is that, if you customer will not say, you need to use your own knowledge of the subject matter to decide this or bring in a subject matter expert to help you decide it." That is not bad news! Equivalence bounds, when not dictated (e.g., by FDA) have a straightforward interpretation: This is, a priori, the smallest difference I care about. E.g., if you find evidence of a difference smaller than this, it is not big enough to matter. That is not something to be calculated from your data, that is simply an expression of your values. $\endgroup$
    – Alexis
    Commented Apr 10, 2023 at 15:50

Your Answer

By clicking “Post Your Answer”, you agree to our terms of service and acknowledge you have read our privacy policy.

Not the answer you're looking for? Browse other questions tagged or ask your own question.