I have the following raw sales timeseries:
Clearly it's not stationary since it does have somewhat of an increasing trend (non-stationarity also verified by DF-test). By differencing I obtain the stationary series:
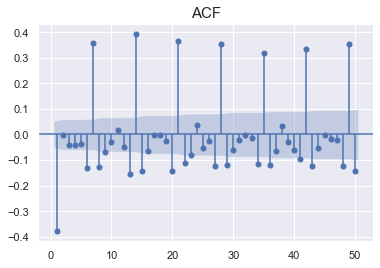
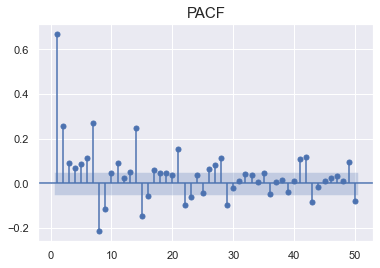
Then I take a peek on the ACF and PACF:
Usually, one looks at both of these to find the order of MA and AR processes then combine them into an ARMA(p,q) process. However I find that the ACF is a bit odd since I have some large positive spikes every 7 lags. There are many significant lags between insignificant ones. And what can explain the first large negative lag?
With inspection of the PACF, we can learn how many AR terms we need to use to explain the autocorrelation pattern in a time series.
For example if the Partial Autocorrelation is significant at only first two lags and the remaining lags abruptly fall to zero, it suggests using an AR term of 2. But in my case the values seem very random and this makes it hard choosing the orders.
Does anyone have a good strategy of dealing with data like this that gives ACF's and PACF's like I've gotten? I'd appreciate any tips and tricks!
PS: Does the volatility clusterings in the data suggest use of a GARCH model instead of an ARMA? Or is there other models that would be better suited?


time=c(1:length(x)); m1=lm(x~time); m2=lm(x~I(time^2)); m3=lm(x~I(exp(time))and such, then extract the fitted values (the thrends) or the residuals (the remainder for further modeling) from thelmobjects. $\endgroup$