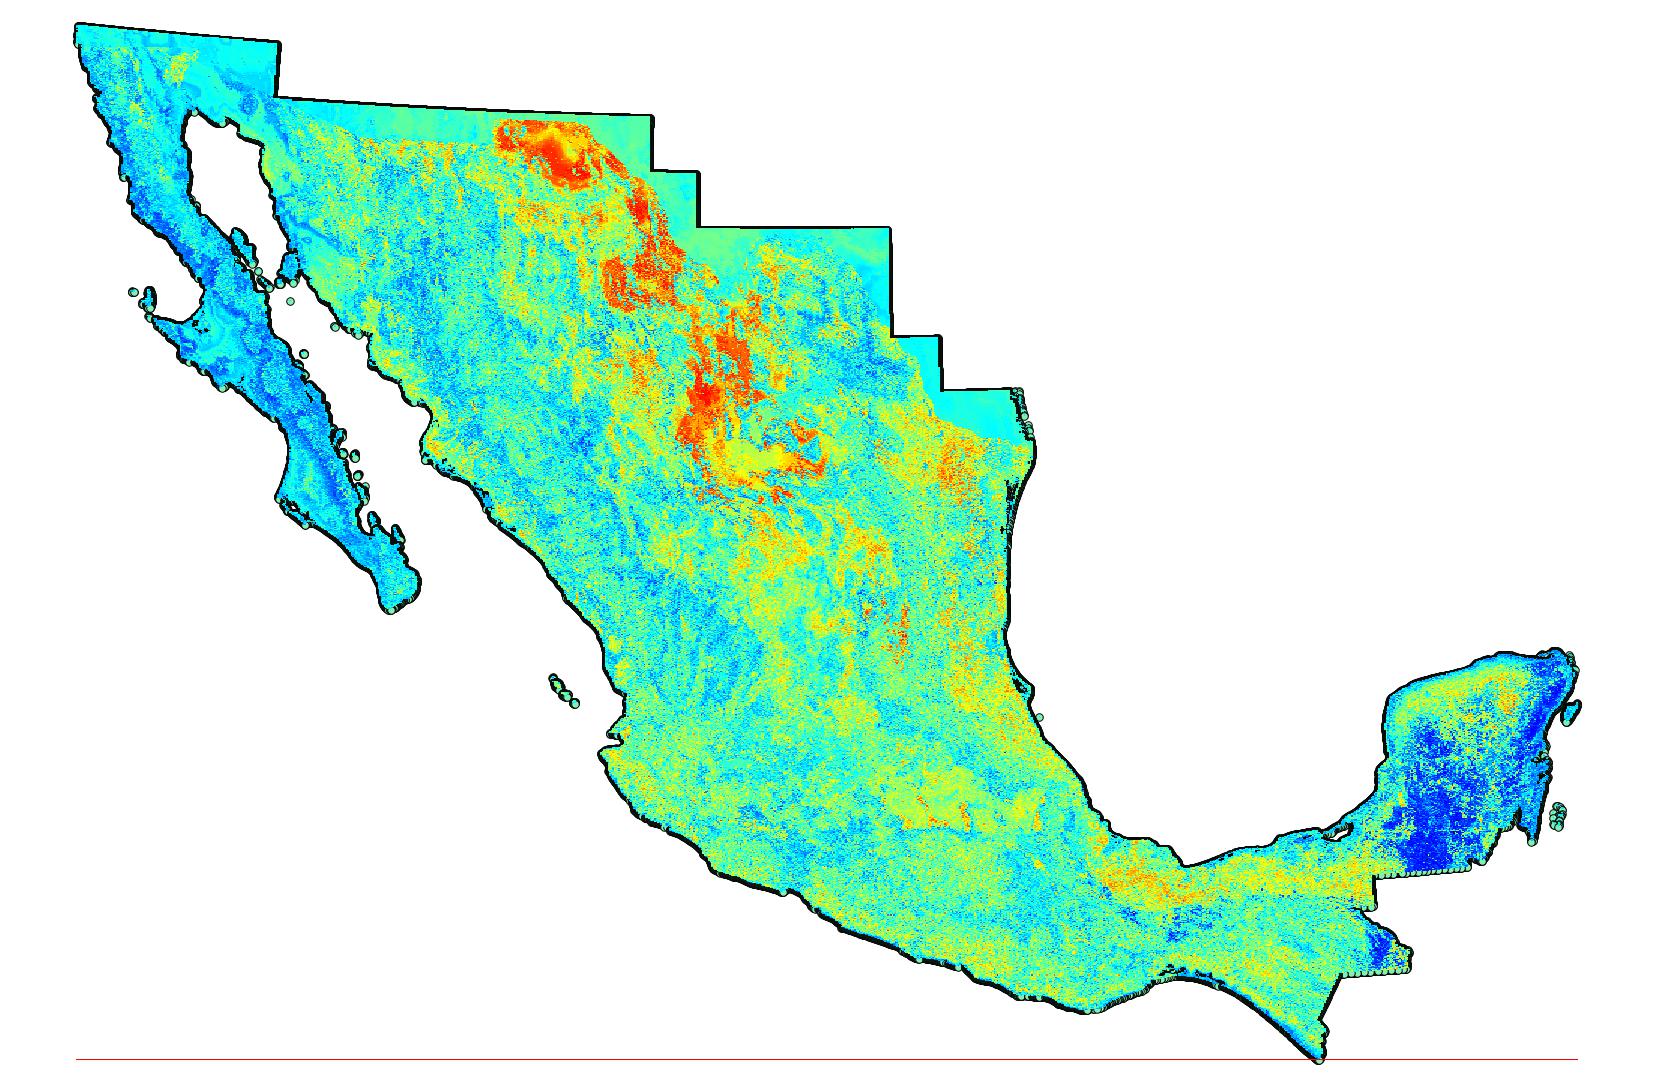
I am currently working with the national forest inventory of Mexico. A sample sceheme that collected data concerning the state of forests on points spread out all over the country. One of these variables is a cualitative one concerning ground damage/degradation due to many causes. E.g. pasture activities. This variable also has associated an ordinal degree of "damage" if there is any, 1: 1%-20%, 2: 20%-40% ... (I dont recall the size of the intervals exactly). As a quick excercise I took this pasture variable and ignored the degree of damage. I just made a binary variable that indicates damage is present / not present. Then I trained a Random Forest classifier using many remote sensing, topographic and climatological variables. These variables are available wall to wall in the country so I can later use the model to generate a map. If I train the classifier using a balanced sample between 1's and 0's and do a hard-classification I get a precision with CV of around 75%. I'm more interested in generating a probability of degradation map so I didnt balance the sample and generated a soft-classification. This would be the probability of class 1 (degradation is present):

Does this excercise make sense to anyone? My true concern is the interpretation. How would one associate these probabilities with what is really going on in the country? Or does anyone have an example of when one would want to associate a soft-classification with a real life phenomenon? To me it makes much more sense to think fuzzily. But I am lost when it comes to describing what is going on.
