2
$\begingroup$

I've been working on a problem where I'm trying to resample from some data given in the form $x_{-dx}^{+Dx}$, where $x$, $x-dx$ and $x+Dx$ are the median, 16th percentile and 84th percentile. Some of these are too skew to be described by a skew normal, for which $1/1.55 \lesssim dx/Dx \lesssim 1.55$. So I've been wondering: what distributions:

  1. have one shape parameter that allows arbitrary skewness and
  2. become the normal distribution when the shape parameter is zero?

Bonus points if it's implemented in scipy.stats. So far the only distribution I've found that satisfies these two conditions is the generalized normal distribution (version 2), which looks something like a shifted, scaled and maybe flipped log-normal.

I've implemented it for myself as a SciPy distribution. I'd open a request to add it to SciPy but I'm not yet sure it's used widely enough to be warranted.

I searched on here for skew normal distributions but mostly came across questions about estimating the parameters of the "ordinary" skew normal I mentioned above.

$\endgroup$
7
  • $\begingroup$ I don't quite understand what you mean by "too skew to be described by a skew normal". The skew normal allows for arbitrary skewness. Your conditions of a zero mean and a normal distribution are met if you use $\xi=0$, $\omega=1$ (or anything else, it's a free parameter) and let $-\infty<\delta<\infty$ vary. Can you explain what is the problem? $\endgroup$ Commented Dec 17, 2021 at 13:57
  • $\begingroup$ Since you write that you have 68% "confidence intervals" (I assume you mean symmetric quantiles, which is something different than CIs), maybe you are not really interested in having a distribution with a specified skewness, but in a distribution with a specified mean (zero) plus two more specified quantiles? $\endgroup$ Commented Dec 17, 2021 at 13:58
  • 1
    $\begingroup$ Since you also need to worry about central tendency and tail heaviness, 4 parameters may be required (location, scale, tail heaviness, asymmetry) as in the skew-t distribution. But also look up Tukey's generalized lambda distribution. $\endgroup$ Commented Dec 17, 2021 at 14:05
  • 1
    $\begingroup$ @StephanKolassa I apologise for not being specific. I have data in a form like x -dx +Dx, where x, x-dx and x+Dx are the median, 16th percentile and 84th percentile. If I set the skewness parameter of a skew normal to infinity, I can't get "skewer" than dx/Dx=1.55. Quoting Wikipedia, "Note, however, that the skewness (γ₁) of the distribution is limited to the interval (−1, 1)." $\endgroup$
    – Warrick
    Commented Dec 17, 2021 at 14:51
  • $\begingroup$ Skewed Lambert W x normal or heavy tail Lambert W x normal with double tails would work for you. $\endgroup$ Commented Dec 17, 2021 at 17:08

2 Answers 2

0
$\begingroup$

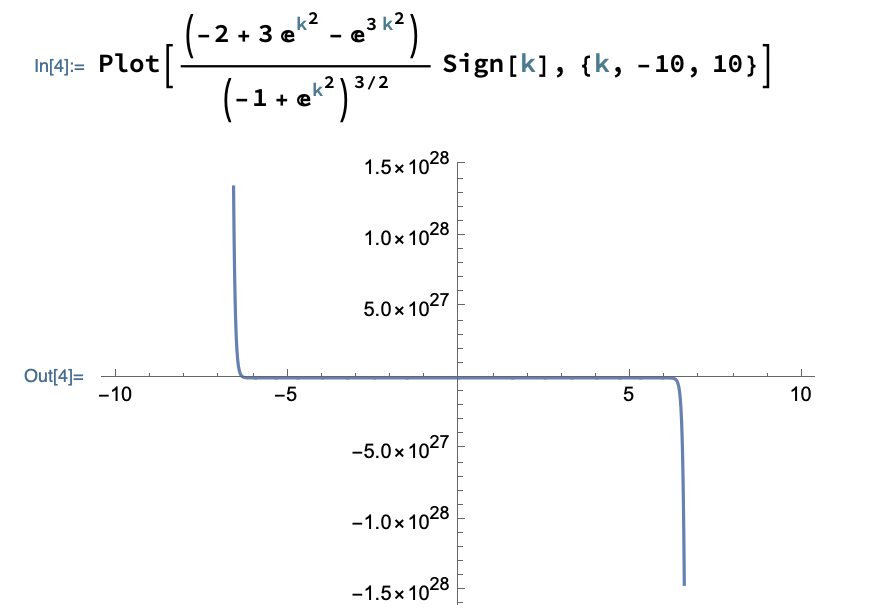
Need more information. The skewness $=\frac{\left(3 e^{k^2}-e^{3 k^2}-2\right) \text{sgn}(k)}{\left(e^{k^2}-1\right)^{3/2}}$ of the Version 2 generalization of the normal distribution is numerically unboundedenter image description here

I think perhaps that skewness alone may not be a sufficient criterion to allow for the answer sought. Either that, or perhaps this is an answer in that the OP seems to be looking at a more restricted version of skewed normal than Version 2 generalized normal distribution. There are other possible answers, for example, via reparemeterization of the gamma distribution in this answer. That involves semi-infinite support of a shifted gamma distribution. I am not sure but part of the problem may be related to the support, that is, if may be difficult to require infinite support AND require infinite skewness.

$\endgroup$
8
  • $\begingroup$ This plot makes no sense as a depiction of any probability distribution: by having negative values it cannot possibly be a PDF or CDF; and by having absolute values exceeding $1,$ it cannot be a characteristic function. Are you sure you aren't just plotting numerical error? $\endgroup$
    – whuber
    Commented Dec 17, 2021 at 18:42
  • $\begingroup$ @whuber You are looking at a plot of skewness, and I say so in the answer, that is, if it is an answer. $\endgroup$
    – Carl
    Commented Dec 17, 2021 at 18:44
  • $\begingroup$ I see, thank you. You don't explicitly say this is a plot of the skewness and in the context it would be natural to interpret that plot (as I did) as somehow depicting the distribution, not its skewness. I don't understand the point of the plot, though, because it's unclear how it is intended to answer the question. $\endgroup$
    – whuber
    Commented Dec 17, 2021 at 18:47
  • 1
    $\begingroup$ @whuber Of course you can suggest that, as did I "I think perhaps that skewness alone may not be a sufficient criterion..." However, it does beg the question, and perhaps it would be better to ask the OP exactly why he wants what he wants. For example, why require asymptotic normality? I am also very interested in tests for tail type, but maybe a different question would be better to get there. $\endgroup$
    – Carl
    Commented Dec 17, 2021 at 20:11
  • 1
    $\begingroup$ Gave you a link to one. True you have to reciprocate a parameter to obtain your desired limit of ND for a limit to zero. $\endgroup$
    – Carl
    Commented Dec 18, 2021 at 14:40
0
$\begingroup$

The skew-normal distribution cannot describe a very skewed distribution with the ratio between two errors exceeding 1.55. In this extreme case, Huang use the linear transformation with a nonlinear one. Since this procedure is quite complicated and does not have much to do with the scientific result in the present work, Huang refers interested readers to the publicly available source code http://zhiqihuang.top/codes/fitskew.py

$\endgroup$

Your Answer

By clicking “Post Your Answer”, you agree to our terms of service and acknowledge you have read our privacy policy.

Not the answer you're looking for? Browse other questions tagged or ask your own question.