0
$\begingroup$

My study is largely exploratory and looks at how environmental factors such as (physical characteristics, water quality and pesticide type and concentration) affect relative antioxidant enzyme mRNA expression. I have categorized my x variables into the 3 aforementioned categories and each category includes a 8-10 variables. Some of these variables were correlated with each other which required removal from the model. I am not 100% sure that this approach is correct in the sense that I included all variables that may have an effect on y "in theory" but not statistically (i.e. I included variables that are not independently correlated with y). This may be wrong but there is mixed info on this topic and my supervisor suggested this approach. In the end, each gene I tested did not have sig relationships with more than one variable regardless. This entire model approach was done for completeness to include all data collected since the results end up being pretty lean.

I am using a backward stepwise model selection approach (every variable is included to begin with) to analyze if explanatory (x) variables are explaining my response variable. I have dealt with multicollinearity already and am using a p value (≤ 0.05) exclusion method for the remaining variables. So I am going one by one, starting with the highest p value and dropping each non significant variable as in Chowdhury & Turin 2020.

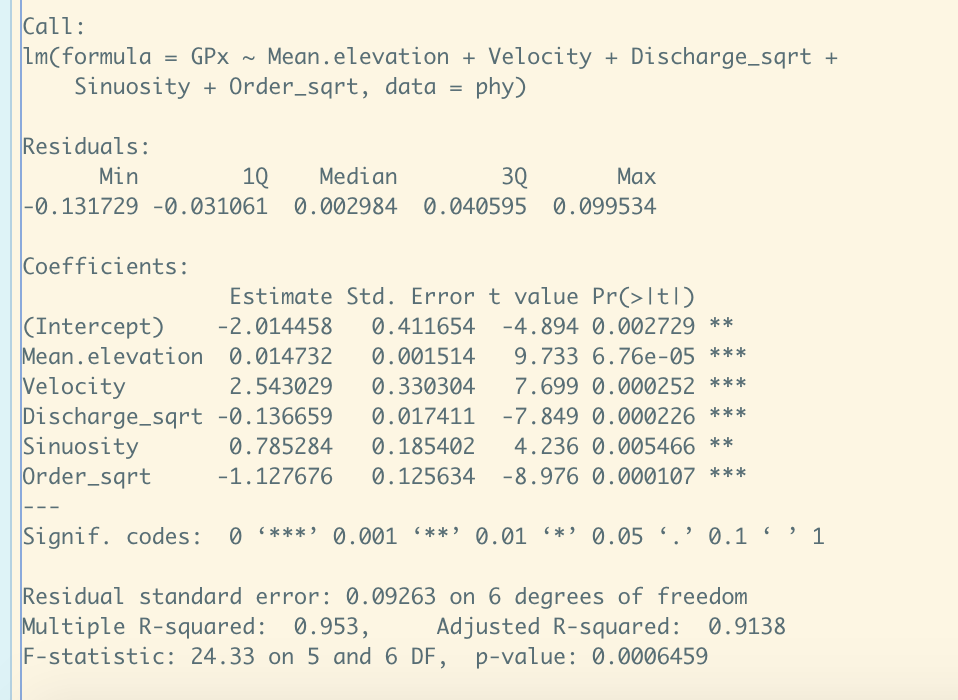
I encountered an issue where several individually non-correlated (x and y) variables are showing to be significant when in the model together. Clearly these results are spurious. I read a few posts that suggest either multicollinearity (not the case here) or confounding variables but I can't seem to find out how to deal with this issue in a statically sound way. Do I report this issue? But how do i decide what to do next to generate the final model (even if the model is non significant in the end).

What I have done so far is just used VIF to determine which of the "sig" variables maybe were correlating with the others in a way that I was unable to detect and deleted the variable with the highest VIF. When I do this, there is no longer any significance which further convinces me that this was just an artifact. Any help would be greatly appreciated as I am trying to write up my PhD dissertation in 6 months and am very strapped for time!

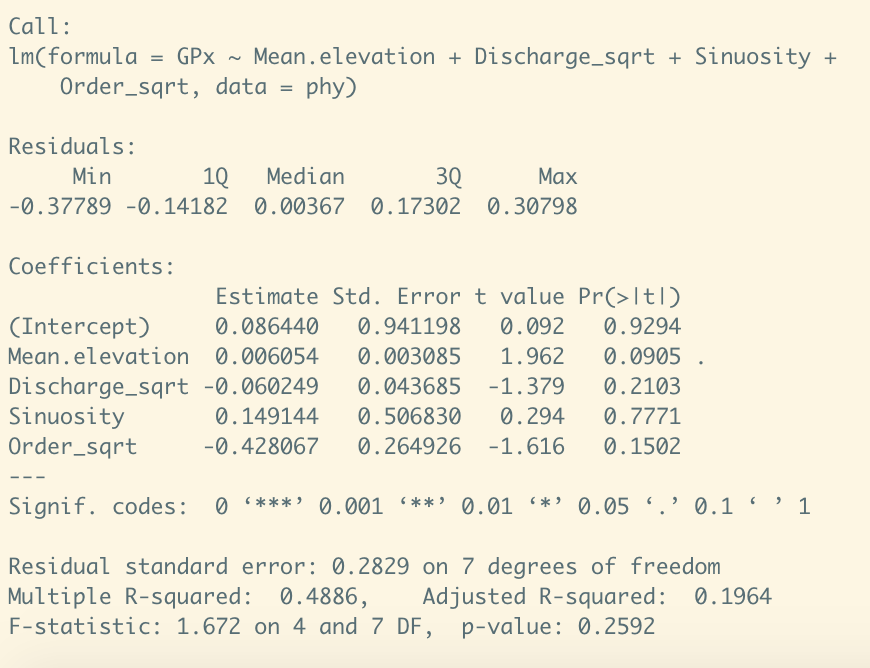
Here is an example of a full model for one category (physical characteristics) enter image description here
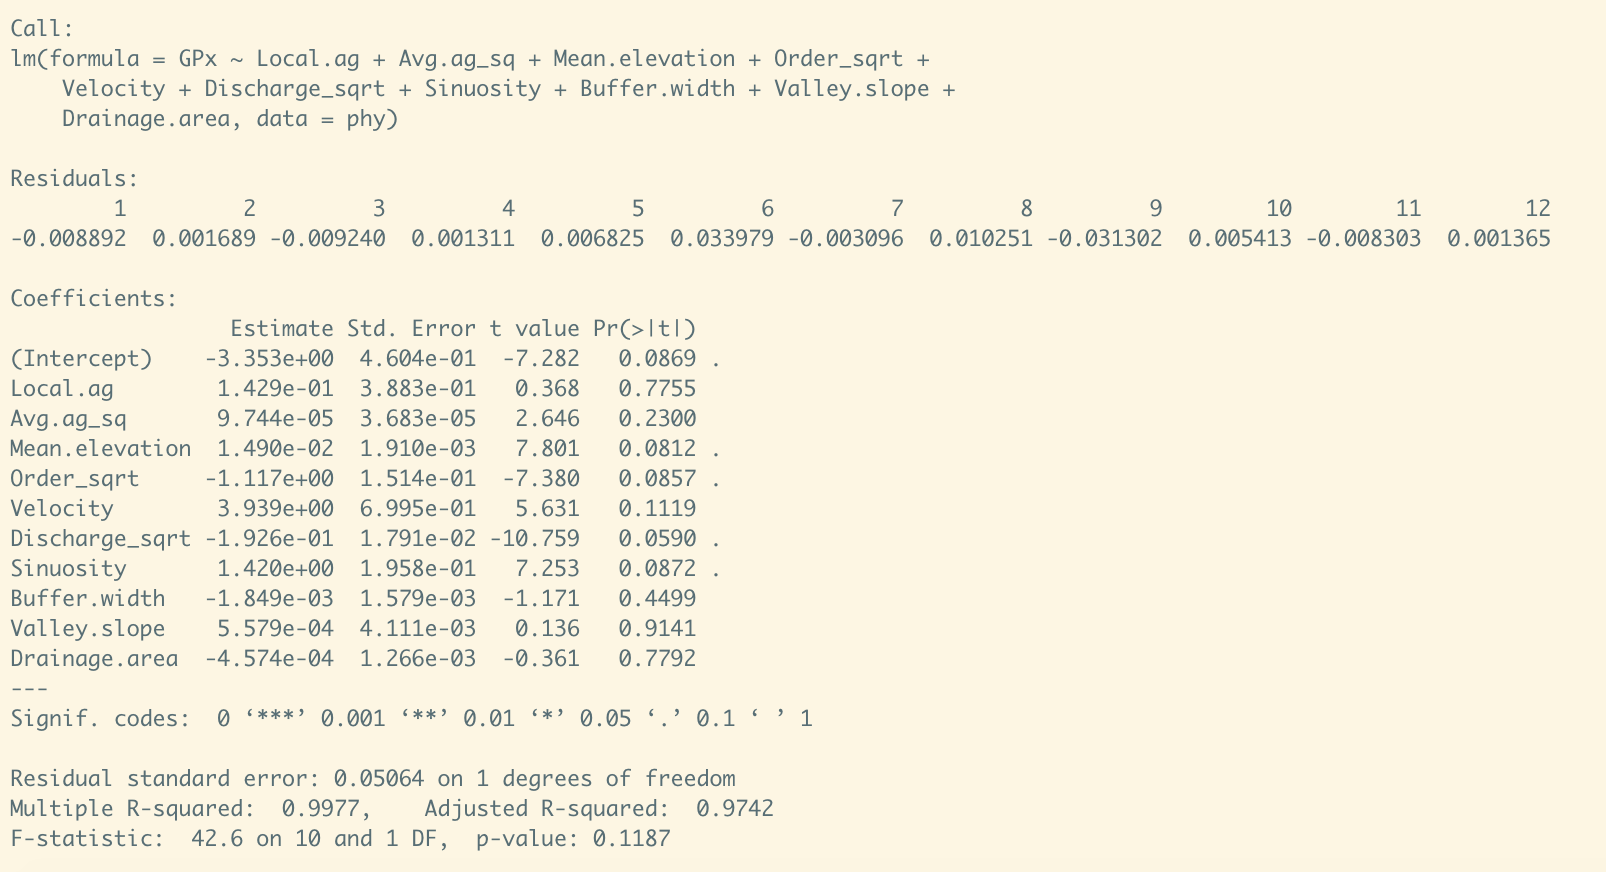
Here is an an example of the issue for context enter image description here
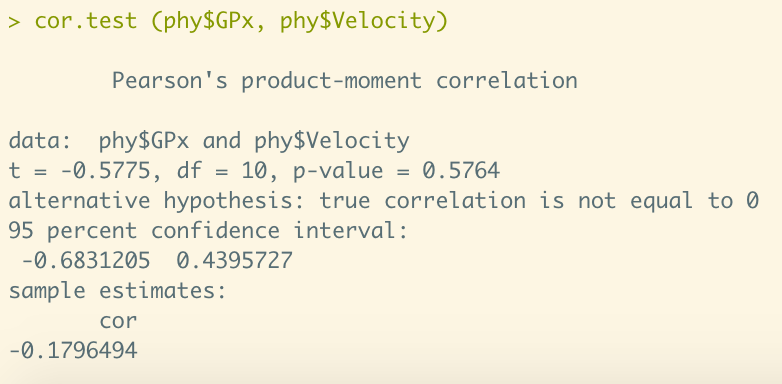
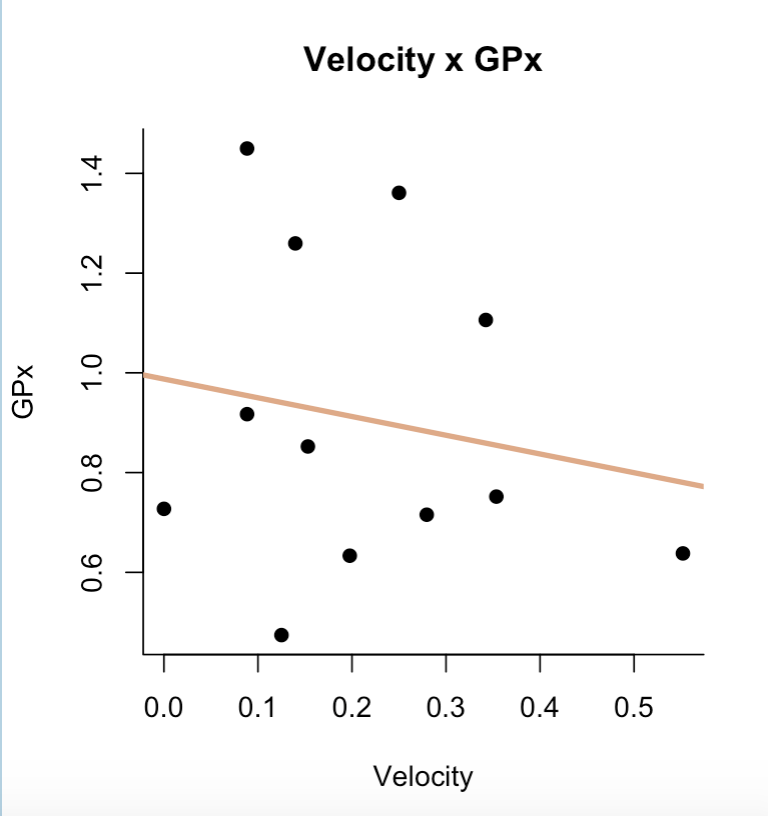
Here is an example of an individual relationship between one x and my y

enter image description here enter image description here

Here are the VIF enter image description here

I removed Velocity

enter image description here

$\endgroup$
5
  • 2
    $\begingroup$ " Clearly these results are spurious" - what does spurious mean here? If you know that if a variable is not correlated with Y it cannot be statistically significant, why would you add it to the model? (A: You don't, so you do.) $\endgroup$ Commented Jan 27, 2022 at 17:43
  • $\begingroup$ Merely removing individual covariates based on their correlation with the dependent variable can be problematic. Rather, why not include all then apply regularization for instance? $\endgroup$ Commented Jan 27, 2022 at 17:43
  • $\begingroup$ Although the question itself is not clear, due to incorrect assumptions, its nature appears to be one that has been discussed before: see stats.stackexchange.com/…. $\endgroup$
    – whuber
    Commented Jan 27, 2022 at 17:47
  • $\begingroup$ If these are complete data, then the real problem seems to be overfitting. You only have a dozen observations yet are trying to fit models with 4-5 predictors. That can lead to a model that fits your data set very well but fails to extend to new data samples. Please edit the question to say more about the study at a higher level: the hypothesis you're trying to test, details of what you've done so far to "deal with multicollinearity," and the number of variables that you started with before you imposed your "exclusion method." There might be better solutions at those early stages of analysis. $\endgroup$
    – EdM
    Commented Jan 27, 2022 at 18:15
  • $\begingroup$ Thanks so much for your feedback so far guys! I just added more details for context and my apologies for the lack of clarity. I am pretty new at complex stats (this is quite complex for me !) $\endgroup$
    – Pria
    Commented Jan 27, 2022 at 18:35

1 Answer 1

1
$\begingroup$

If you only have 12 observations in a biological/ecological study, as your plot and regression summaries indicate, it's really hard to get reliable results from regression. The main problem here is overfitting, not multicollinearity among predictors.

The usual rule of thumb for regression analysis in such studies is that you shouldn't try to evaluate more than 1 predictor for every 10-20 observations.* Otherwise you will tend to get an overfitted model that doesn't generalize well to new data samples. You only show data from 12 observations.

That's the problem you face. Your "full model" evaluated 10 predictors on 12 observations. With the necessary addition of an intercept to the model, that left only 1 "degree of freedom" to allow for variability in outcomes not accounted for by the predictors. The very high $R^2$ value in that model was because there was almost no way for the 12 data points to deviate from the 10-predictor model.

You then removed enough predictors to get to a 5-predictor model. But as the selection of which to remove was driven by how well things fit your data set, you ended up with a model in which the remaining 5 predictors still fit your data set almost perfectly. It almost certainly would not work on a new data set. Note that neither your "full model" (p = 0.12) nor your 4-predictor model (p = 0.26) showed overall statistical significance by the usual p < 0.05 criterion.

Also, breaking up your predictors into classes and then doing separate regressions on each of them is generally not a good idea. Then you can't examine how different types of predictors work together.

There might be ways to get something useful here, but that will probably require working closely with an experienced local statistician to whom you can explain details of your study and what you are trying to accomplish scientifically.

For example, you can try to combine multiple predictors of the same type intelligently--but without looking at the outcome values--into a single predictor, based on your understanding of the subject matter. I'd recommend that you look at Frank Harrell's course notes on regression modeling, in particular Chapter 4, with careful attention to section 4.7 on data reduction. That might give you some ideas about how to combine multiple predictors usefully.

To get around the overfitting problem with too many predictors even after you've combined many of them, you could try ridge regression. That so-called "penalized" or "regularized" method allows you to use more predictors without overfitting than with standard regression, because it reduces the magnitudes of the regression coefficients to compensate. That is implemented in the R glmnet package, with an example worked through in Section 6.6.1 of An Introduction to Statistical Learning. I'd advise against using the variable-selection methods described in that chapter of ISL, like forward-stepwise, best-subset, or LASSO regressions, as the particular predictors selected typically don't carry over well to new samples.


*It won't help even if you have mRNA values for multiple enzymes at each of 12 observation locations, as you will effectively be doing regressions for each type of mRNA.

$\endgroup$

Your Answer

By clicking “Post Your Answer”, you agree to our terms of service and acknowledge you have read our privacy policy.

Not the answer you're looking for? Browse other questions tagged or ask your own question.