1
$\begingroup$

I asked players to play a game where the outcome (number of successes) should be based on pure chance. However, players could cheat and increase their number of successes. Cheating is not actually a bad thing in my game, I am just using this word for ease of exposition. For each number of successes, I want to calculate the probability that the players with that number of successes cheated.

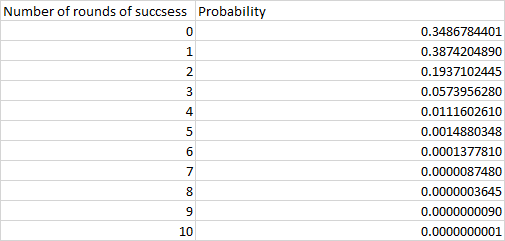
I will explain the game. Players chose 1 of 10 numbers for 10 rounds. Every round, only 1 of the 10 numbers means that a player is successful. So in each of the 10 rounds, a player has a 10% probability to be successful. Using Bernoulli's Trial I computed the expected probability of the total number of rounds in which a player will be successful. I post them in the table below.

enter image description here

In the data from the game, I can see that many players manage to be successful in all 10 rounds. Let's say that 20 out of 1,000 (2%) of players succeeded in all 10 rounds although, in expectation, only 0.0000001 players (1000 players * the probability that one player succeeds in all 10 rounds) should have succeeded in all 10 rounds. Can I calculate the probability that 20 out of 1,000 players succeeding in 10 rounds is due to cheating and not due to chance?

I want to calculate this number for each level of success. So, for example, 3 out of 1,000 (0.03%) players succeeded in 5 rounds although, in expectation, only 1.4880348 players (1000 players * the probability that one player succeeds in 5 rounds) should have succeeded in 5 rounds. So in general I want to know, for an actual number of players that succeeded for x rounds, what is the probability that their level of success is due to cheating and not due to chance?

I think I should not use a Binomial Test as presented here (https://www.randomservices.org/random/hypothesis/Bernoulli.html). This test, as I understand it, checks if the mean number of wins across all players is different than the expected mean number of wins.

Any help would be appreciated. Thank you.

$\endgroup$

1 Answer 1

0
$\begingroup$

I'm not sure I understand the description of the game, but the table clearly shows the PDF of $\mathsf{Binom}(10, 0.1).$

Then you ask "Can I calculate the probability that 20 out of 1,000 players succeeding in 10 rounds is due to cheating and not due to chance?"

It seems as if you want to test $H_0: p = (0.1)^{10}$ against $H_0: p > (0.1)^{10},$ at the 5% level based on results from $n = 1000$ plays of the game in which $x$ players got a Success (the same number all ten times).

In view of the extreme skewness of this binomial distribution, I think you should use an exact binomial test to get the P-value for such a test, rather than an approximate normal test (as in your link). In R binom.test with only $x = 1$ claim of Success, I get the result below. The P-value is very nearly $0.$

binom.test(1, 1000, p=(0.1)^10, alt = "g")

        Exact binomial test

data:  1 and 1000
number of successes = 1, number of trials = 1000, 
 p-value = 1e-07
alternative hypothesis: 
 true probability of success is not equal to 1e-10
95 percent confidence interval:
 2.531749e-05 5.558924e-03
 sample estimates:
probability of success 
                 0.001 

A direct computation of this P-value is in agreement, except for rounding of a number very near $0.$ So even one claim of Success would be strong evidence of 'cheating'. [If more than $x = 1$ of the 1000 participants claimed a Success, the P-value would be even smaller.]

1-pbinom(0, 1000, .1^10)
[1] 9.999999e-08    # aprx 1e-07

Note: An analogous, but 'milder', game would be to roll a fair die five times and to get a 'Success' if all five rolls showed the same face.

dbinom(5, 5, 1/6)
[1] 0.0001286008
(1/6)^5
[1] 0.0001286008

binom.test(1, 100, p=(1/6)^5, alt = "g")

        Exact binomial test

data:  1 and 100
number of successes = 1, number of trials = 100, 
 p-value = 0.01278
alternative hypothesis: 
 true probability of success is greater than 0.0001286008
95 percent confidence interval:
  0.0005128014 1.0000000000
sample estimates:
 probability of success 
                   0.01 

For this game only one claim of 'Success' in 100 would raise suspicions of 'cheating' at the 2% level but not quite at the 1% level.

$\endgroup$
4
  • 1
    $\begingroup$ Thank you so much for your help. $\endgroup$
    – Razvan
    Commented Jan 31, 2022 at 20:43
  • $\begingroup$ I only need to understand one more thing. In your example, you calculate the probability that all 5 die get a 6. This is part of what I am interested in. However, I want to calculate the p value for all possibilities, not just the possibility where all 5 die show a 6. Let's say I roll the dice 100 times (20 series of 5 dice rolls). I then observe that in 15 of these series of 5 dice rolls, I got 4 die to show a 6. It is clear that 15 series in which 4 die show 6 is unlikely to be due to chance. How can I calculate exactly how unlikely this is? Again, thank you very much for your help so far. $\endgroup$
    – Razvan
    Commented Jan 31, 2022 at 20:54
  • $\begingroup$ I showed you a 'direct' method to find the P-value for your original question. Adjust that to get $P(X \ge x)$ for values of $x$ greater than $1$. E.g. for $P(X\ge 5) = 1 - P(X \le 4).$ Use the binomial formula, software, or (as appropriate) a normal approximation. $\endgroup$
    – BruceET
    Commented Jan 31, 2022 at 21:19
  • $\begingroup$ Thank you, I will read up on your solution and will approve it. Sorry I don't know immediately if it is the correct answer. $\endgroup$
    – Razvan
    Commented Feb 1, 2022 at 6:43

Your Answer

By clicking “Post Your Answer”, you agree to our terms of service and acknowledge you have read our privacy policy.

Not the answer you're looking for? Browse other questions tagged or ask your own question.