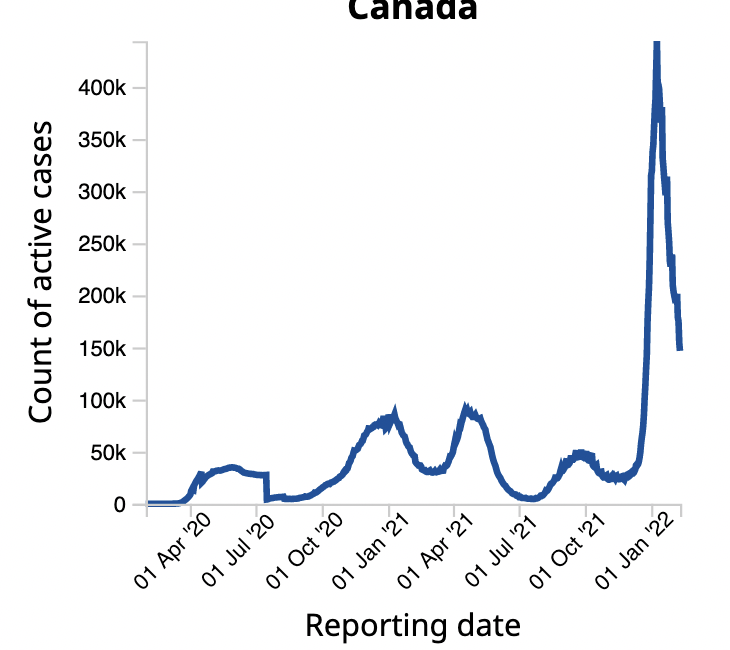
Having seen some of the plots, e.g., https://health-infobase.canada.ca/covid-19/epidemiological-summary-covid-19-cases.html

There doesn't seem to be enough stable periodicity to warrant time series treatment. I would treat it as a mixture model, which, for the graph above, would be 5 scaled distributions. Those will then have mean times, and variances for each "wave." For regressing count data, I would use a Poisson loss function, which as an $L_2$ is $$\Bigg|\Bigg|\sqrt{\#cases}-\dfrac{f_{mix}(t)}{\sqrt{\#cases}}\Bigg|\Bigg|_2$$.
The variances of the distributions themselves (without scaling) are then the appropriate statistics.
EDIT: However, those variances are results and not raw data that can be used for comparison of variances using the Levine test, Conover test or Brown Forsythe test. To do that latter, one could reassign the original count data to be apportioned to each separate distribution resulting in 5 separate data sets, and only then can the variances be compared. Perhaps Lecture 16 by
Grosse and Srivastava may be of help in so doing.
I would caution, however, that one cannot assume stationarity with impunity, as testing methods may have been a moving target, including but not limited to the percentage of counted cases being variably related to the number of total cases, because many cases were unreported, and the effect of "vaccination" varied in time as vaccination increased. One can, despite that, assume stationarity to obtain a preliminary estimate. Vaccination likely did not do much to case numbers, because the current crop of inoculations are unlike polio vaccines and do not confer immunity. If you wish, you can test that under the assumption that infection rates per contagion are similar, or different if you want to waste time on it. In practice, such factors as masking, social distancing, embargo and quarantine are relatively minor, but may have a slight and variable effect on variance. In fact, if you compare Florida and New York, you might see some blunting of the curves in NY, with little other effect, but testing for whether the cause of that is the difference of mostly useless governmental policy, or whether that is merely because the mass dynamic difference is inherent to a larger NY population will be difficult.
Finally, good luck, as no one will believe the results because science has been so corrupted by politics that publishing them will be like throwing a dead vulture into a den of starving jackals.

