3
$\begingroup$

I'm reading the technical manual for a linking study between two assessments. It's pretty clear that the table is model output from a fitted logistic regression equation. Here's what pass odds look like on test 2 as a function of score on test 1 (RIT score):
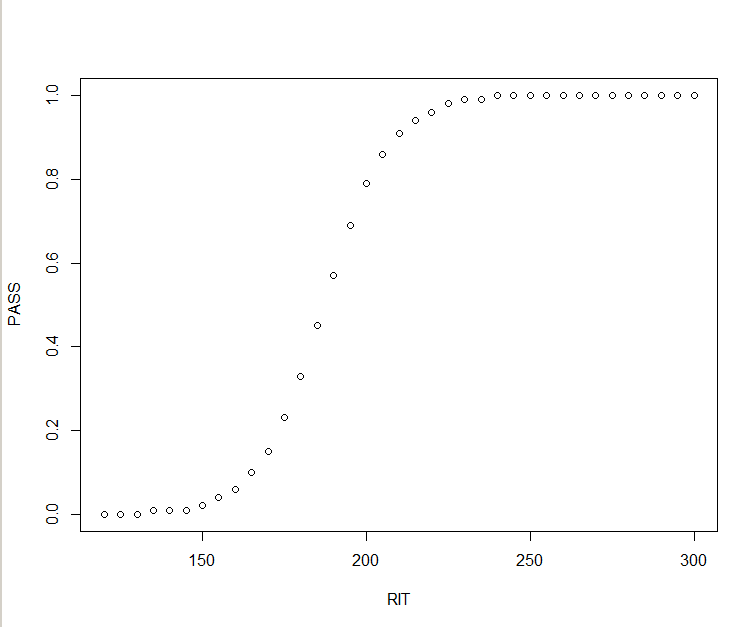
enter image description here

It seems silly to use a lookup table that rounds to 5 when the model that made that table could give a better estimate. But how do I recreate that equation from this output?

I have a good sense of how I would fit this model if I had the raw data, but I'm not sure what to do here. Not glm(family=binomial) because the data I have is are odds ratios, not pass / no pass (i.e., 1s and 0s), right?

Here's the data:

PASS <- c(0, 0, 0, 0.01, 0.01, 0.01, 0.02, 0.04, 0.06, 0.1, 0.15, 0.23, 
0.33, 0.45, 0.57, 0.69, 0.79, 0.86, 0.91, 0.94, 0.96, 0.98, 0.99, 
0.99, 1, 1, 1, 1, 1, 1, 1, 1, 1, 1, 1, 1, 1)

RIT <- c(120L, 125L, 130L, 135L, 140L, 145L, 150L, 155L, 160L, 165L, 
170L, 175L, 180L, 185L, 190L, 195L, 200L, 205L, 210L, 215L, 220L, 
225L, 230L, 235L, 240L, 245L, 250L, 255L, 260L, 265L, 270L, 275L, 
280L, 285L, 290L, 295L, 300L)
$\endgroup$

1 Answer 1

2
$\begingroup$

Logistic regression is linear when the parameter, $\pi$, that controls the behavior of the Bernoulli response is transformed into a log odds:
$$ \ln\left(\frac{\pi_i}{1-\pi_i}\right) = \beta_0 + \beta_1x_i $$ Your variable PASS is a vector of predicted probabilities. These can be converted into log odds using the LHS of the equation above. Once there, these should form a straight line as a function of RIT. Here is some R code to do this:

oPASS = PASS / (1-PASS)
loPASS = log(oPASS)

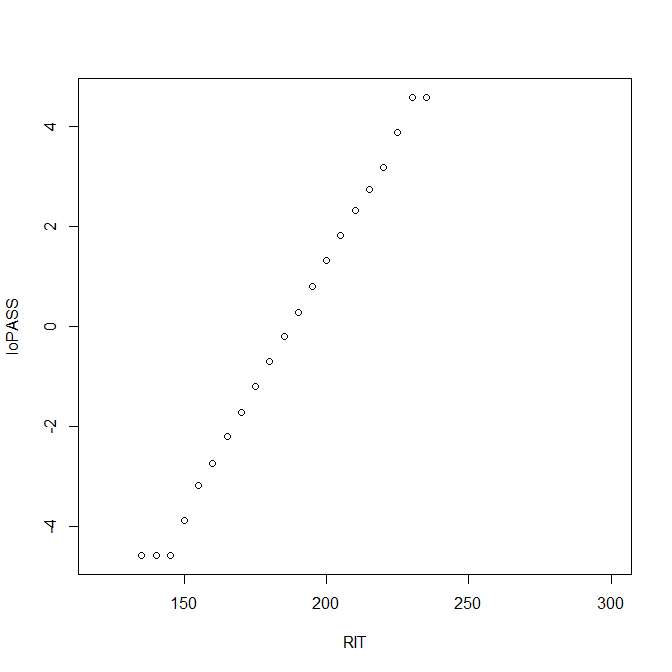
A plot of these values shows that there was some rounding in the predicted probabilities that you were given:

enter image description here

You can also see the issue if you look at the loPASS variable:

> loPASS
 [1]       -Inf       -Inf       -Inf -4.5951199 -4.5951199 -4.5951199
 [7] -3.8918203 -3.1780538 -2.7515353 -2.1972246 -1.7346011 -1.2083112
[13] -0.7081851 -0.2006707  0.2818512  0.8001193  1.3249254  1.8152900
[19]  2.3136349  2.7515353  3.1780538  3.8918203  4.5951199  4.5951199
[25]        Inf        Inf        Inf        Inf        Inf        Inf
[31]        Inf        Inf        Inf        Inf        Inf        Inf
[37]        Inf

Thus, we will work with the 7th & 23rd data points to get a reasonably accurate result.

Once we have these values, we can calculate the slope using the point-slope formula, and the intercept, by algebraically rearranging the equation of the line:

b1 = (loPASS[23]-loPASS[7]) / (RIT[23]-RIT[7])
b0 = loPASS[7] - b1*RIT[7]

That yields the parameter estimates that had been used to generate the predicted probabilities that you were given:

> b0
[1] -19.80483
> b1
[1] 0.1060868

For more information about logistic regression, it may help you to read my answer here: difference-between-logit-and-probit-models.

$\endgroup$

Your Answer

By clicking “Post Your Answer”, you agree to our terms of service and acknowledge you have read our privacy policy.

Not the answer you're looking for? Browse other questions tagged or ask your own question.