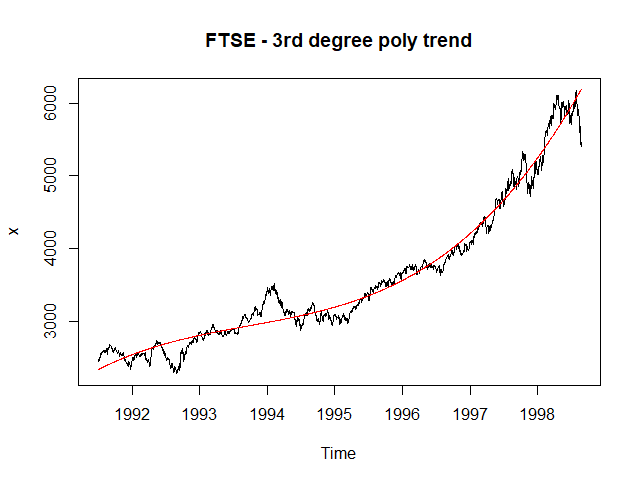
I'm asked to fit a polynomial model on the FTSE column from the EuStockMarkets dataset available in R. How is it possible to fit on just one column in this case? Is there another column of sorts in time series data that I can manipulate like time? i.e. Would time be a feature in predicting FTSE?
-
$\begingroup$ Are you asking whether that's possible to do (yes), or whether you would actually do this in practice for a stock index specifically (no)? $\endgroup$– Chris HaugCommented Mar 6, 2022 at 13:28
-
$\begingroup$ Hi Chris thanks for reviewing this question. I'm looking for the former, I'm not familiar with polynomial models or time series data but I can't see how it'd be possible to fit on a single column. i.e. Should I be using the tslm function in R or be trying to append year values into a df and run the usual lm function and add degrees? $\endgroup$– harryCommented Mar 6, 2022 at 21:13
1 Answer
It sounds like what you are being asked to do is fit a model in which there is a trend which is polynomial in time (where $f(t)$ is a polynomial):
$$Y_t = f(t) + \varepsilon_t$$
If the $\varepsilon_t$ are iid, you can fit this by OLS. Something like this will work:
x <- datasets::EuStockMarkets[,"FTSE"]
mod <- lm(x ~ poly(as.vector(time(x)), 3))

plot(x, main = "FTSE - 3rd degree poly trend"))
lines(ts(fitted(mod), start = start(x), frequency = frequency(x)), col = 'red')
If the $\varepsilon_t$ are actually autocorrelated, you could look at regression-with-ARIMA-errors (e.g. forecast::Arima) as a next step.
There is a small issue here which is that stock prices are not observed regularly (not on weekends or holidays, usually). In datasets::EuStockMarkets, the data is encoded as if it was regularly sampled 260 times per year, but in reality the "real" time between certain pairs of neighboring observations is longer than others, and for example you might expect that Monday's price will typically be further from the preceding Friday's than from the following Tuesday, since more time has passed in between. Regardless, the information contained in datasets::EuStockMarkets does not allow you to reconstruct the exact calendar that would include these gaps. If you could, though, you could easily fit the model with gaps by just passing in the right $t$ for each observation, whether they are equidistant or not.
I will also point out that, for stock prices specifically, this model will not be appropriate, for any degree. You'll want something like a (geometric) random walk, with GARCH effects, as a baseline.
-
$\begingroup$ Thank you Chris, yes I tried comparing the degrees using the below:
dat <- EuStockMarkets df <- data.frame(as.matrix(dat), date=time(dat)) df <- df[, 4:5] degree4<- lm(df$FTSE ~ poly(df$date, degree = 4, raw = T)) degree8<- lm(df$FTSE ~ poly(df$date, degree = 8, raw = T)) degree12<- lm(df$FTSE ~ poly(df$date, degree = 12, raw = T))And could not see much difference for any degree. $\endgroup$– harryCommented Mar 6, 2022 at 23:31

