0
$\begingroup$

MY PROBLEM: I need to test for statistical significance between the three groups. The problem comes when extremely large numbers are involved and the chi-square test is always significant. I read several related questions however I didn't find a solution. What test should I use?

  1. How to test for a statistically significant difference between 3 percentages?
  2. Which statistical test for statistical significance of positive result in 5 categories of samples
  3. How to test for a statistically significant difference between multiple unbalanced groups

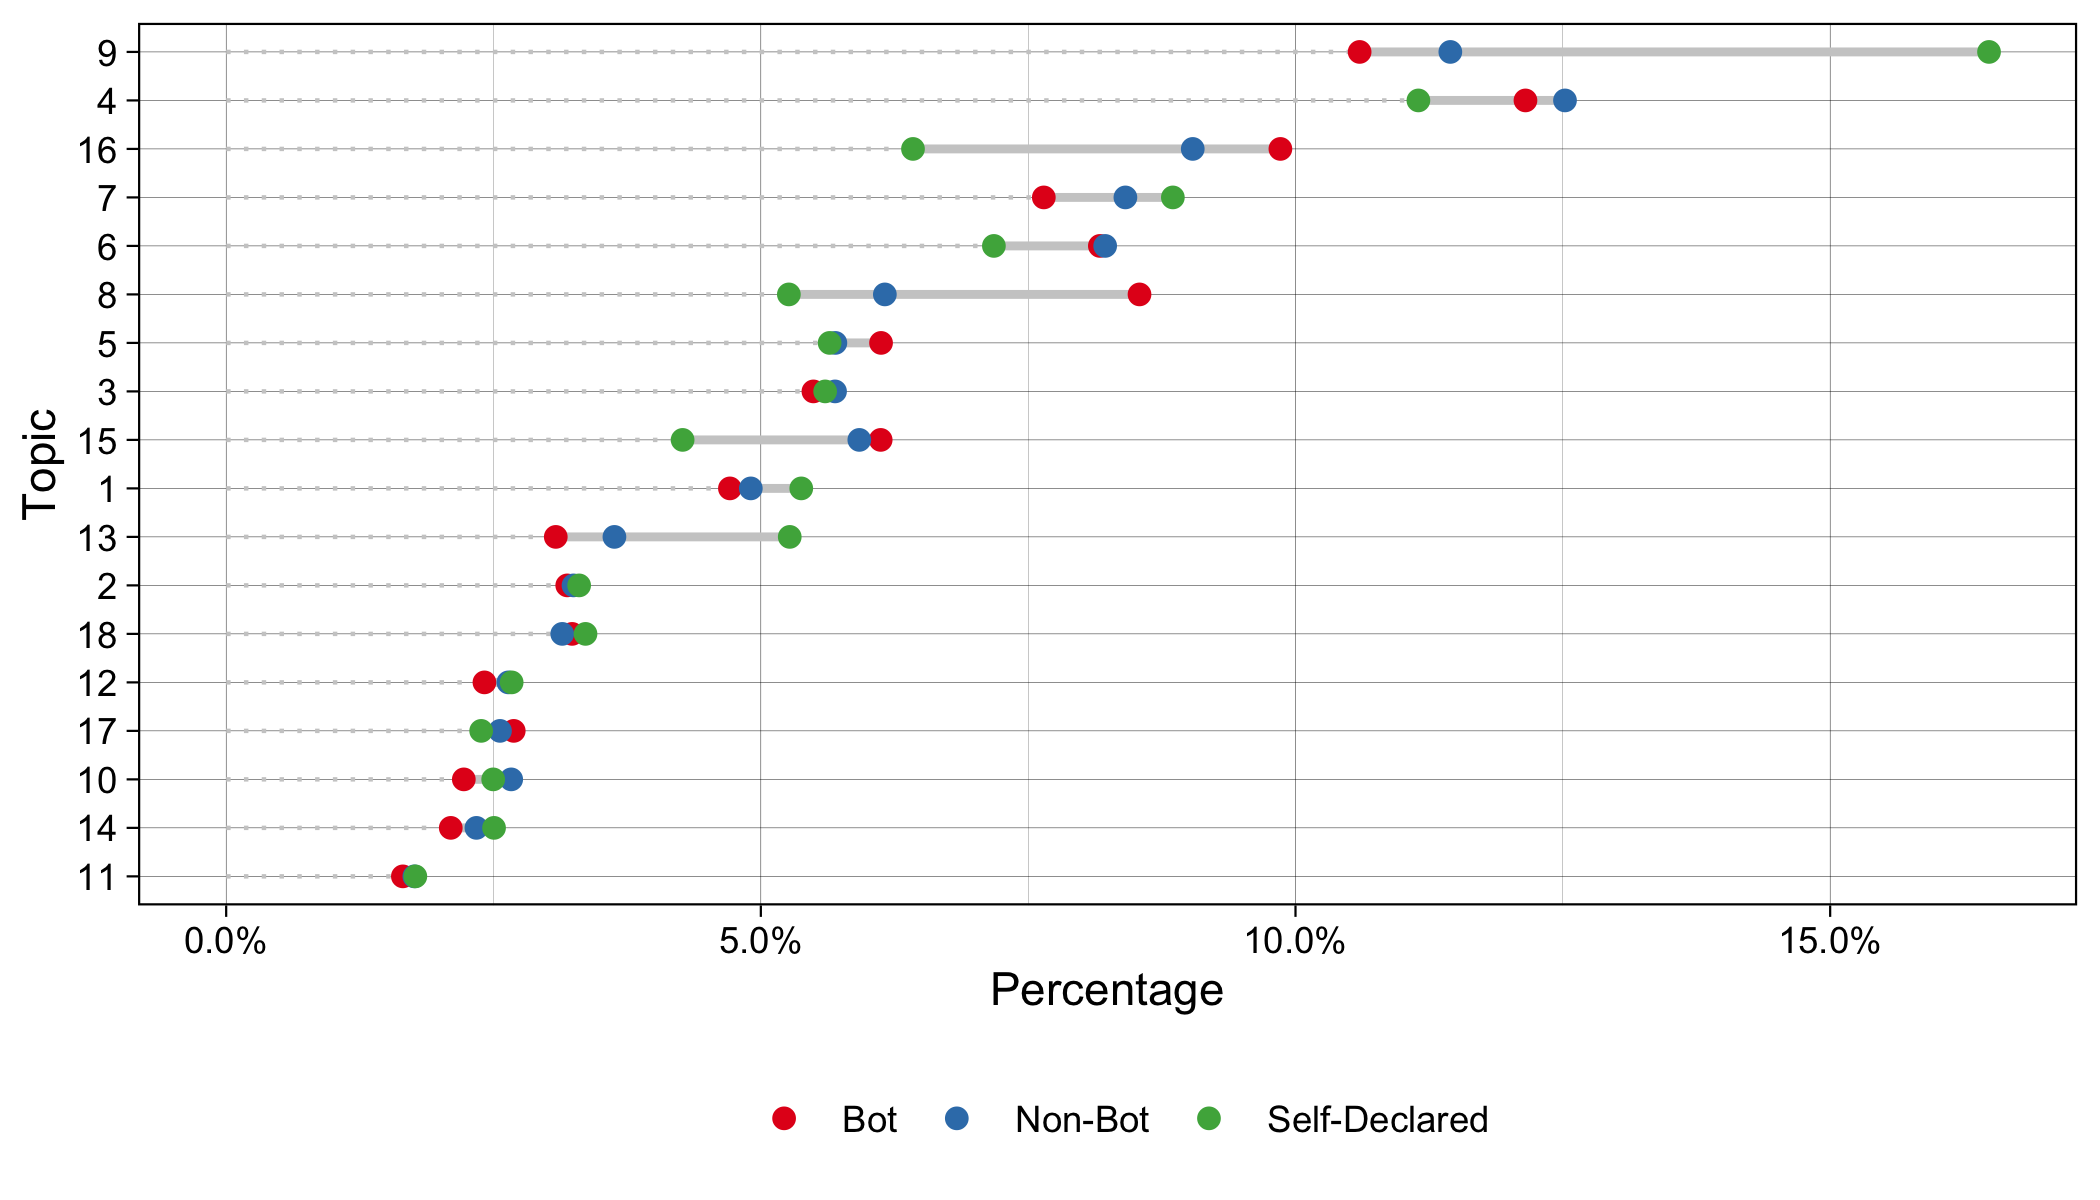
MY DATA: We classify tweets into three different groups if the account is: bot/non-bot/self-declared. Then each of the tweets is classified into 18 different topics. We need to check if there are topics where tweets sent by accounts classified as bots (or non-bots or self-declared) are more common.

The total number of tweets written from each of the groups is:

  • Bot 1,106,255
  • Non-Bot 8,218,070
  • Self Declared 1,101,219

For Topic 14 and Topic 9 the distribution is as follows:

Bot Non-Bot Self-Declared
Topic 14 23234 192319 27585
No Topic 14 1083021 8025751 1073634
Percentage 2.1% 2.4% 2.6%
Topic 9 117259 940800 181543
No Topic 9 988996 7277270 919676
Percentage 11.9% 12.9% 19.7%

Following this method, we plotted this chart enter image description here

$\endgroup$
3
  • 4
    $\begingroup$ General comment about sample sizes and hypothesis testing: huge sample sizes almost always leads to a statistically significant result regardless of the practical significance of the result. You might be better off defining a threshold ($x$%) and if the different in percentage row is more than $\pm x$% you deem the result "meaningful". The choice of $x$ is something a domain expert/you should come up with $\endgroup$
    – jcken
    Commented Apr 19, 2022 at 11:01
  • 2
    $\begingroup$ I don't quite understand the question. You already mentioned the chi-squared test (or F-test), which would be the appropriate test for multiple equations, i.e. in your case the null would be over the (de-meaned) means or percentages of the 3 groups: $H_0: \hat \mu_1 - \mu= 0; \hat \mu_2 - \mu= 0; \hat \mu_3 - \mu= 0$, which implicitly tests if the groups are the same (i.e. differences zero). If the result is significant then that's your answer: there is a statistically significant difference between the groups. Why are you looking for a different test? $\endgroup$
    – PaulG
    Commented Apr 19, 2022 at 13:22
  • $\begingroup$ @PaulG the problem is that with big numbers chi-squared test is always significant. $\endgroup$
    – Tito Sanz
    Commented Apr 20, 2022 at 9:19

0

Your Answer

By clicking “Post Your Answer”, you agree to our terms of service and acknowledge you have read our privacy policy.