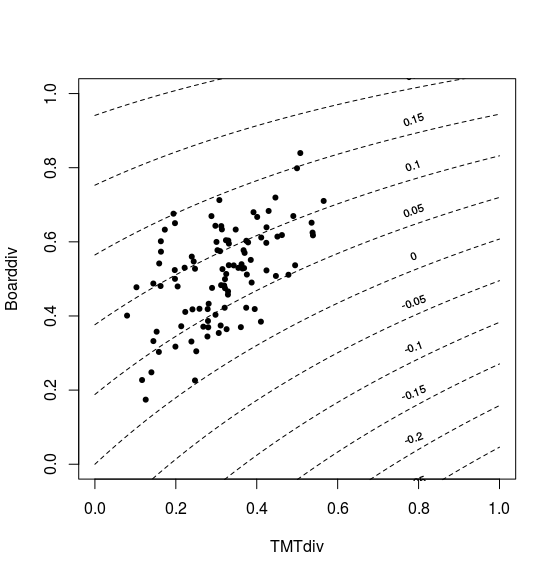
I'm investigating the influence of top management team nationality diversity (TMTdiv, continuous between 0-1) and board nationality diversity (Boarddiv, continuous between 0-1) on firm internationalization (count of new foreign market entries).
I'm using a negative binomial regression due to overdispersion and I would like to know how to interpret the main and interaction effects of these two variables. All of my variables are standardized. If I understand correctly, the negative main effect of TMTdiv (-0.27052) indicates that for a one unit increase (i.e., one standard deviation increase) in TMTdiv while Boarddiv is zero (i.e., at average since data are standardized), the expected count of new foreign market entries decreases by a factor of exp(-0.27052)=0.76, or 0.24%. Similarly, for a one unit increase in Boarddiv while TMTdiv is zero, the expected outcome increases by exp(0.26567)=1.30, or 30%. As for the interaction, the effect of TMTdiv on new market entries increases by a factor exp(0.17965) ≈ 1.19, or 19% for a one unit increase in Boarddiv. Likewise, the effect of Boarddiv increases 19% for a one unit increase in TMTdiv.
My ex-ante hypothesis regarding TMTdiv stated a positive relationship between this variable and interationalization. My question is how to interpret a counterintuitive negative main effect of TMTdiv in light of a positive Boarddiv main effect and a positive interaction with Boarddiv as well? Is there perhaps a way to calculate a net effect? At which value of BoardDiv would the negative influence of TMTdiv on internationalization be minimized?
    Call:
    glm.nb(formula = Entry ~ Control1 + Control2
      + Control3 +  Control4 + Control5 +
        Control6 + Control7 + Control8 +
        Control9 + factor(SIC1) + factor(Year) +
        Control10 + TMTdiversity *
        BoardDiversity, data = data,
        init.theta = 1.090577033, link = log)

    Deviance Residuals:
        Min       1Q   Median       3Q      Max
    -2.1654  -1.1399  -0.4089   0.2878   2.4788

    Coefficients:
                           Estimate Std. Error z value   Pr(>|z|)
    (Intercept)             0.09543    0.31723   0.301    0.76354
    Control1                0.26129    0.16089   1.624    0.10436
    Control2               -0.10568    0.09433  -1.120    0.26254
    Control3                0.01053    0.08214   0.128    0.89803
    Control4               -0.07133    0.09095  -0.784    0.43285
    Control5                0.07227    0.12183   0.593    0.55304
    Control6                0.14621    0.10905   1.341    0.17999
    Control7                0.07330    0.12111   0.605    0.54504
    Control8                0.09151    0.09010   1.016    0.30979
    Control9                0.08741    0.09077   0.963    0.33555
    factor(SIC1)2           0.53152    0.36787   1.445    0.14849
    factor(SIC1)3           1.06711    0.37244   2.865    0.00417 **
    factor(SIC1)4           0.34078    0.37400   0.911    0.36220
    factor(SIC1)5           0.85303    0.35066   2.433    0.01499 *
    factor(SIC1)6           0.49310    0.34369   1.435    0.15137
    factor(SIC1)7           1.06508    0.44184   2.411    0.01593 *
    factor(SIC1)8           2.07867    0.45733   4.545 0.00000549 ***
    factor(Year)2012       -0.81119    0.18053  -4.493 0.00000701 ***
    factor(Year)2013       -0.25712    0.17094  -1.504    0.13254
    Control10              -0.05225    0.08735  -0.598    0.54970
    TMTdiv                 -0.27052    0.14007  -1.931    0.05345 .
    Boarddiv                0.26567    0.13965   1.902    0.05711 .
    TMTdiv:BoardDiv         0.17965    0.10642   1.688    0.09139 .
    ---
    Signif. codes:  0 ‘***’ 0.001 ‘**’ 0.01 ‘*’ 0.05 ‘.’ 0.1 ‘ ’ 1

    (Dispersion parameter for Negative Binomial(1.0906) family taken to be 1)

        Null deviance: 402.74  on 296  degrees of freedom
    Residual deviance: 307.19  on 274  degrees of freedom
    AIC: 1130.7

    Number of Fisher Scoring iterations: 1


                  Theta:  1.091
              Std. Err.:  0.159

     2 x log-likelihood:  -1082.666

