3
$\begingroup$

In classification problems, "non-probabilistic" machine learning models such as boosted trees, neural networks, etc. are known to produce poorly-calibrated class scores, which aren't suitable for use as posterior probability estimates.

See e.g. "On Calibration of Modern Neural Networks" (Guo et al, 2017) and "Obtaining Calibrated Probabilities from Boosting" (Niculescu-Mizil & Caruana, 2012).

However, are the rankings of scores still generally valid?

For example, consider a classification neural network with 5 outputs. Is it valid to treat the output scores as ranks? Suppose the model predicts scores of A:0.64, B:0.23, C:0.10, D:0.02, and E:0.01. Is it valid to say that classes A-C are the "top 3" model predictions? Is it valid to say that class B is more probable than class C for this prediction?

I have done this many times in my own work, and I haven't seen it produce bad results. But I have also never considered if there are known problems with this procedure, either theoretical or empirical.

$\endgroup$
5
  • 1
    $\begingroup$ It probably depends on 100 different factors, but there's no logical reason why poorly calibrated (predicted probabilities aren't necessarily correct) has to mean the rankings (ordinal relations between the predicted probabilities) are poor. $\endgroup$ Commented Apr 20, 2022 at 17:24
  • $\begingroup$ That was my thinking as well. I suppose it's difficult to answer this question with a "yes", so I am mostly fishing to see if there is any strong "no" that I am not currently aware of. $\endgroup$ Commented Apr 20, 2022 at 17:27
  • $\begingroup$ Empirically, for a given model, wouldn't a probability calibration plot answer this question for you? $\endgroup$
    – Ryan Volpi
    Commented Apr 20, 2022 at 18:41
  • $\begingroup$ @RyanVolpi maybe! Would you just check for decreasing sections of the calibration plot? $\endgroup$ Commented Apr 20, 2022 at 18:43
  • $\begingroup$ That's what I would look for. $\endgroup$
    – Ryan Volpi
    Commented Apr 20, 2022 at 18:48

1 Answer 1

1
$\begingroup$

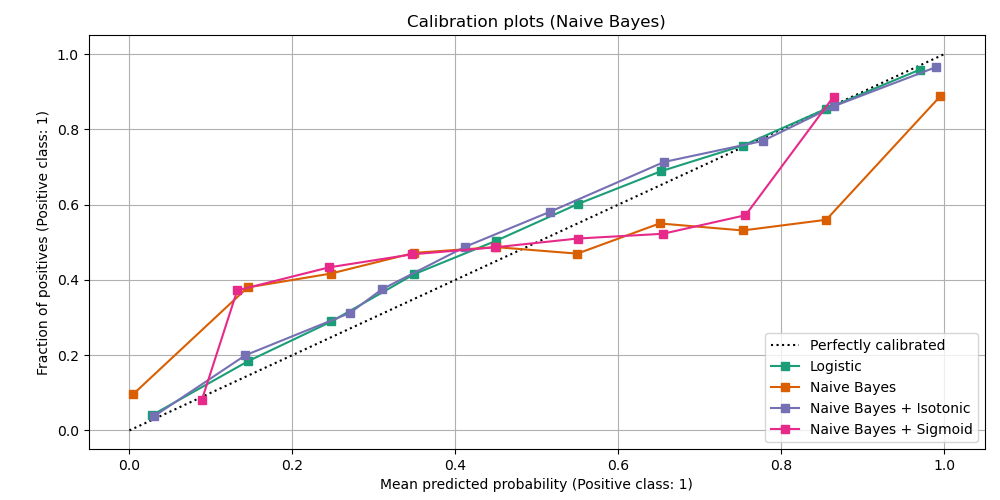
The sklearn documentation discusses calibration. One of the example models (in orange) is a naïve Bayes model that has a descending calibration curve, meaning that observations with larger estimated probabilities of occurrence actually occur less often.

sklearn calibration

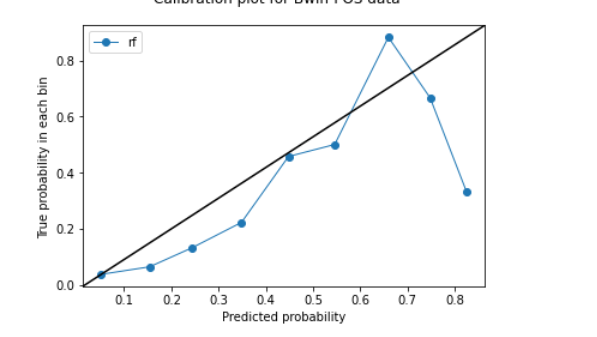
A member of this community has posted an example where the same phenomenon occurs but is even more visually extreme.

The Great calibration

Those seem to be examples where the rankings are wrong.

$\endgroup$

Your Answer

By clicking “Post Your Answer”, you agree to our terms of service and acknowledge you have read our privacy policy.

Not the answer you're looking for? Browse other questions tagged or ask your own question.