Thanks for reading. I wanted to ask if my logic I used for my experiment makes any sense. My hypothesis is that watching Pepsi commercial increases Pepsi preference.
My experiment has 2 steps.
(1) Baseline measurement
I have gathered 80 participants and asked them to choose one of 2 drinks (Coke or Pepsi) for 20 days. If they chose Coke we gave them a can of coke, and vice versa. (They could also choose neither of them and get nothing.)
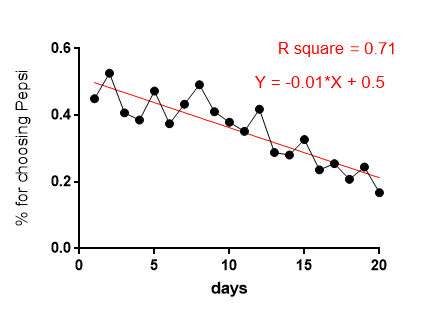
We tracked the preference and found that (1) they preferred Coke over Pepsi and (2) coke-preference was getting even more evident.
To confirm the 2nd finding, I performed the linear regression and the result is shown below(in red line).
(2) Preference Shift Test
In 21st day, before making a choice, I divided 80 people in to 4 groups (80 into 20, 20, 20, 20).
To 1st group I showed them Pepsi advertisement. To each of other group, I showed them different advertisements (group2: Fanta, group3: Sprite, group4: Dr. Pepper).
And I found that Pepsi-choice was increased to 60% in group 1, while in group 2~4, it slight decreased. And my goal was to show the increase in group 1 is statistically significant.
To do this, My plan was as below:
(a) Estimate the baseline level for choosing Pepsi using linear regression model
(b) Compare the baseline level to measured proportion (60%) by one-sample binomial test.
For (a) estimating the baseline level, I used the result from the linear regression above (Y=-0.01*X + 0.43). So I changed "X" to 21 and got Y = 22%.
Here's my question.
Would it be correct to use such 22% as chance level for one-sample binomial test?
I am unsure because although it is based on the model prediction, I haven't seen anyone use binomial test like this before.
I'm having trouble because I cannot use two-sample proportion test (z-test) as my sample is not big enough to meet the assumptions (np>=10, n(p-1)>=10). I also can't use Fisher's Exact test nor Mcnemar Test.

