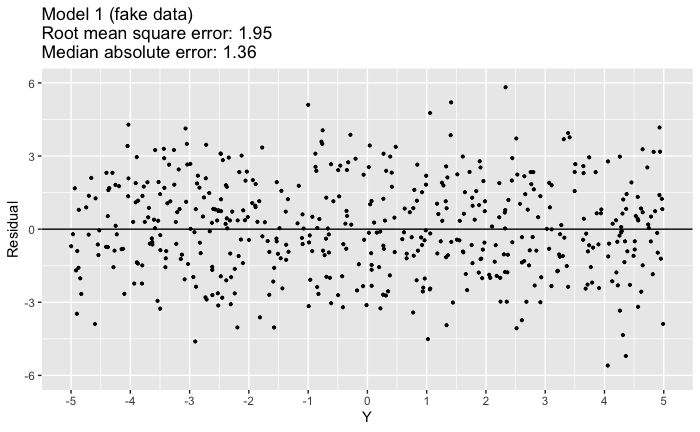
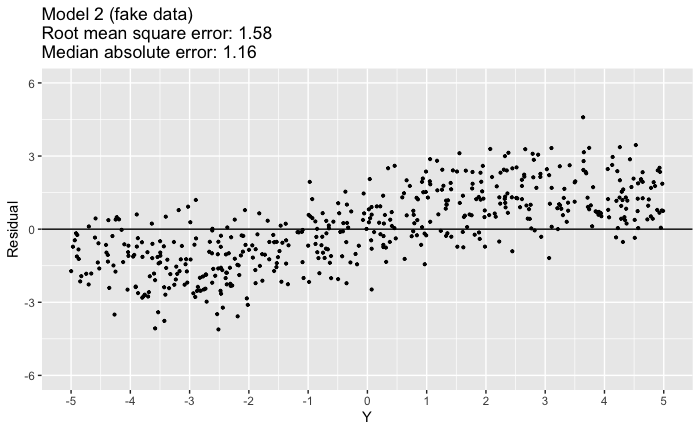
Say I am selecting between models, and I especially value mean-0 error throughout the entire range of the data. I am looking for metrics that specifically capture this property.
For example, take the following residual plots. The first represents the kind of performance I want: if you fit a curve to the errors it would be basically flat and at 0. Knowing Y does not give you any knowledge of what the error will be. The second, though having lower RMSE and MAE, over- and under-predicts depending on the range of Y.
library(ggplot2)
set.seed(321)
n <- 500
y <- runif(n = n, min = -5, max = 5)

df_good <- data.frame(y = y,
                      resid_ = rnorm(n = n, mean = 0, sd = 2))
good_rmse <- sqrt(mean(df_good$resid_ ^ 2))
good_mae <- median(abs(df_good$resid_))

ggplot(df_good, aes(x = y, y = resid_)) +
  geom_point(size = 0.75) +
  scale_x_continuous(name = "Y",
                     breaks = -5:5) +
  scale_y_continuous(name = "Residual",
                     limits = c(-6, 6)) +
  geom_hline(yintercept = 0) +
  ggtitle(paste0("Model 1 (fake data)\n",
                 "Root mean square error: ", round(good_rmse, 2),
                 "\nMedian absolute error: ", round(good_mae, 2)))

df_bad <- data.frame(y = y,
                     resid_ = 1.5 * sin(y / 2) + rnorm(n = n, mean = 0, sd = 1))
bad_rmse <- sqrt(mean(df_bad$resid_ ^ 2))
bad_mae <- median(abs(df_bad$resid_))

ggplot(df_bad, aes(x = y, y = resid_)) +
  geom_point(size = 0.75) +
  scale_x_continuous(name = "Y",
                     breaks = -5:5) +
  scale_y_continuous(name = "Residual",
                     limits = c(-6, 6)) +
  geom_hline(yintercept = 0) +
  ggtitle(paste0("Model 2 (fake data)\n",
                 "Root mean square error: ", round(bad_rmse, 2),
                 "\nMedian absolute error: ", round(bad_mae, 2)))
I want an error metric that prefers model 1 to model 2.
Some background if this seems contrived: I am limited to a small class of models. Judged by RMSE/MAE etc, these models all perform similarly well. The small differences in RMSE between them are not material to the application at hand. However, what is material is the flatness of the error curve - despite similar performance in the main, some models do a far better job of seeming to obey $E[\epsilon|X] = 0$ for all $X$. Other models seem to over/underpredict certain ranges consistently (though not by enough to seriously impact the RMSE). This is very undesirable given the application.
The problem is that I can only see this difference in performance when I look at plots. I can't find any solid mathematical measure that quantifies this. I have some ideas, neither of which feel right:
- Bucket by pre-determined $Y$ ranges and calculate the mean error (raw, not absolute). Perform model selection by somehow combining the scores for each bucket.
- For each model, train a more sophisticated (meta) model (splines, polynomials, etc) with $Y$ as the predictor and the model's residuals as the output. If this meta-model is able to predict the model's residual with any degree of accuracy, it means that the property I desire is absent. So, perform model selection based on which model's errors are least able to be predicted by the meta-model.
However, these methods feel a little patched-together. I feel like there is some standard solution I just haven't found. It may be worth noting that I do not desire this property for inference's sake; I know that the $E[\epsilon|X] = 0$ assumption is very relevant in that world, but I'm purely concerned with prediction. It just so happens that, for the case in question, this kind of "expectation of error not conditional on the range of data" is very important to the usefulness of the predictions.


