5
$\begingroup$

We have a random numbers generator (it is actually a physical device standing outside of our building). By collecting of about 3000 numbers, generated by the device, we came to the conclusion that the mean of the generated numbers is positive (although it is close to zero). The statistical significance of this conclusion is quite good.

Recently we started to suspect that when temperatures outside are high, the device tends to generate slightly smaller numbers. Even more, we suspect that when temperature is above a threshold temperature, the mean of the generated numbers is negative (although we do not know what is exactly the value of this threshold temperature).

I also need to add, that we have a reason to believe, that the dependency of the mean of the generated numbers on the temperature is a step function. To make it more clear, we believe that when temperature is high enough two parts of the device disconnect from each other and the device switches to a new "regime" (associated with the generation of presumably smaller numbers).

So, my question is, how can we calculate the statistical significance of our hypothesis that there is a temperature triggered switch in the mean of the generated numbers?

We could, for example, find a value of the threshold temperature empirically such that the mean of the numbers, generated by the device, is negative and as low as possible and then we could calculate the statistical significance that the mean of these values is really negative (in the statistical sense). However, I guess that this approach is false, since we have manually chosen the split such that numbers corresponding to the high temperature are small, so it is not fair to prove if they have statistically significant negative mean.

In other words, would a threshold value of the temperature be given, we could just check if we have a statistical evidence to believe that values, corresponding to the high temperatures, have negative mean.

ADDED:

My question is not about physics. The "physical device" does not exists. I made the example just to make it less abstract and easier to grasp.

$\endgroup$
17
  • 1
    $\begingroup$ @FrankHarrell I don't follow your argument. Bimetallic strips in a variety of appliances are used to force temperature-dependent discontinuities. Phase transitions of matter are a natural physical discontinuity. Why wouldn't these be possible causes of such a change? $\endgroup$
    – mkt
    Commented Jul 15, 2022 at 12:12
  • 2
    $\begingroup$ @Roman It would help if you edited your question to make clear that this is a made-up example and not an actual device. If you include details like this, it's natural for readers to question the details. Explain your actual underlying question/situation in addition to your hypothetical example. $\endgroup$
    – mkt
    Commented Jul 15, 2022 at 12:14
  • 3
    $\begingroup$ Even classical physical laws lead to all kinds of discontinuous behavior. This, in part, is what chaos theory was invented to help explain. For numerous practical examples, check out any stress-strain study in engineering that seeks to estimate breaking points of materials or look at any phase diagram of a chemical system. $\endgroup$
    – whuber
    Commented Jul 15, 2022 at 13:19
  • 1
    $\begingroup$ I don't think the existence of an interaction negates the existence of a discontinuity. But this begins to stray too far from the question at hand. $\endgroup$
    – mkt
    Commented Jul 15, 2022 at 13:58
  • 3
    $\begingroup$ I don't understand why the false advertising. Why make up a fun story about a physical device and freezing temperatures and then say "hey, it doesn't exist; I made all of it up!" You dedicate three paragraphs to this made-up story and then let people down with the denouement. $\endgroup$
    – dipetkov
    Commented Jul 22, 2022 at 9:37

4 Answers 4

3
+150
$\begingroup$

You could consider "post-selection inference" methods. This is a collection of approaches to getting p-values (or confidence intervals) for a selected model's parameters, designed to be valid given that you ran model-selection first instead of using a model chosen a priori. In your case, the "model selection" consists of using your dataset to choose a temperature changepoint, before you use the same dataset to test for statistical significance of this changepoint.

Take a look at Hyun et al. (2020), "Post-selection inference for changepoint detection algorithms with application to copy number variation data," Biometrics:
https://onlinelibrary.wiley.com/doi/10.1111/biom.13422
Preprint version:
https://www.stat.cmu.edu/~ryantibs/papers/binseginf.pdf

The basic idea, as I understand it: Find the temperature changepoint on your real dataset. Compute a test statistic for comparing the means of the response-variable, below vs above this estimated changepoint. Then, when you compare this test statistic against a null distribution... do not build this null distribution from all datasets where the null hypothesis of no-difference-in-means is true. Instead, build the null distribution only using those null datasets that also would have chosen the same changepoint as your real dataset did.

The clever math for how to do this is in the paper, and they also provide associated R software:
https://github.com/sangwon-hyun/binseginf/

Hyun et al. also mention a much simpler data-splitting approach. (It has less power, but might be good enough if your dataset is large.) First sort your dataset by temperature, and split it in half in alternating order: all the odd indices vs all the even indices. Then simply estimate your changepoint on one dataset, and use a usual t-test on the other dataset.

$\endgroup$
2
  • $\begingroup$ Inspired by your description of the procedure, I thought about the following procedure: We find a step function on the real data set by minimization of squared errors. Then, by use of resampling, we create a random data without any dependency on the parameter ("temperature") and search again for the best step function. We check how frequently we get the same squared error, or smaller, on the data set that has no dependency. It will be the p-value. Is there reasons why not to do it? $\endgroup$
    – Roman
    Commented Jul 25, 2022 at 11:18
  • 1
    $\begingroup$ What you describe sounds like a test of "Is there a step somewhere?" but not necessarily "Is there a step here, at the temperature we found using this method?" ... Either one might be fine, depending on the purpose of your analysis, but they are not the same. $\endgroup$
    – civilstat
    Commented Jul 25, 2022 at 21:10
2
$\begingroup$

Just in case a Bayesian approach is of interest, there are some potential tools readily available in R or Python for use. The one probably most appropriate for your case is the mcp package--regression with multiple changepoints. Another popular one is bcp. But here I will choose a package Rbeast (https://github.com/zhaokg/Rbeast) most familiar to me (bcz I wrote it) to illustrate the ideas using the sample data from @user4422:

set.seed(1)
n_obs <- 4000
temperatures                <- rnorm(n_obs)
random_numbers              <- rnorm(n_obs)

temperature_threshold       <- 1.5
increase_if_above_threshold <- 0.5
random_numbers[temperatures>temperature_threshold]=random_numbers[temperatures>temperature_threshold]  + increase_if_above_threshold           

df <- data.frame(random_numbers, temperatures)
df <- df[order(df$temperature),]

library(Rbeast)
out = beast( 
            df$random_numbers, 
            season='none',        # only consider a trend component
            torder.minmax=c(0,0), # the piecewise trend is modelled as flat lines (i.e., the min and max polynomial orders are both 0)
            tcp.minmax  =c(0,1) # as in your case, the possible range of number of changepoints are 0 to 1.
           );

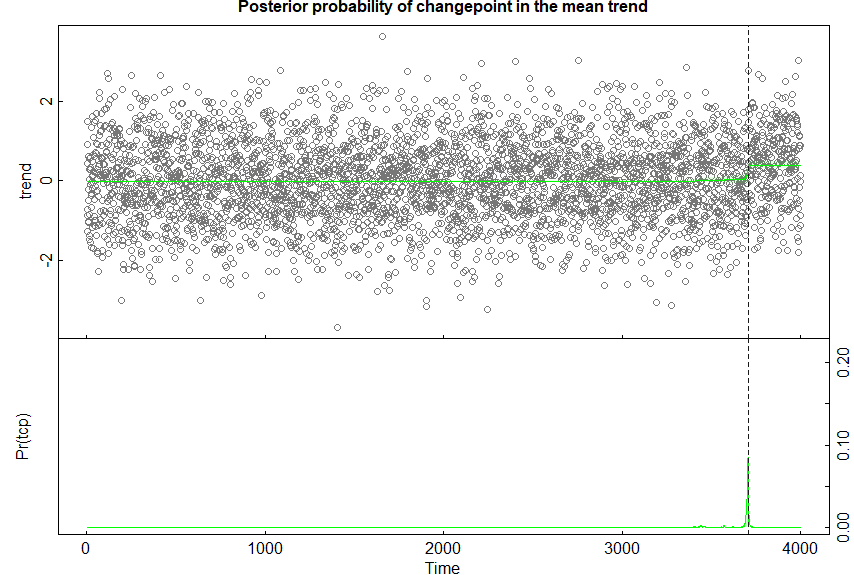
plot(out, vars=c("y","t","tcp"), main='Posterior probability of changepoint in the mean trend')

In the 'prob' subplot below is a curve of probability of changepoint occurrence. Apparently, peaks correspond to locations where changepoints occur. enter image description here

Print out some addition posterior statistics: The posterior probability of observing a mean shift at 3748 is 0.845.

print(out)

#####################################################################
#                      Trend  Changepoints                          #
#####################################################################
.-------------------------------------------------------------------.
| Ascii plot of probability distribution for number of chgpts (ncp) |
.-------------------------------------------------------------------.
|Pr(ncp = 0 )=0.009|*                                               |
|Pr(ncp = 1 )=0.991|*********************************************** |
.-------------------------------------------------------------------.
|    Summary for number of Trend ChangePoints (tcp)                 |
.-------------------------------------------------------------------.
|ncp_max    = 1    | MaxTrendKnotNum: A parameter you set           |
|ncp_mode   = 1    | Pr(ncp= 1)=0.99: There is a 99.1% probability  |
|                  | that the trend component has  1 changepoint(s).|
|ncp_mean   = 0.99 | Sum{ncp*Pr(ncp)} for ncp = 0,...,1             |
|ncp_pct10  = 1.00 | 10% percentile for number of changepoints      |
|ncp_median = 1.00 | 50% percentile: Median number of changepoints  |
|ncp_pct90  = 1.00 | 90% percentile for number of changepoints      |
.-------------------------------------------------------------------.
| List of probable trend changepoints ranked by probability of      |
| occurrence: Please combine the ncp reported above to determine    |
| which changepoints below are  practically meaningful              |
'-------------------------------------------------------------------'
|tcp#              |time (cp)                  |prob(cpPr)          |
|------------------|---------------------------|--------------------|
|1                 |3748.000000                |0.84592             |
.-------------------------------------------------------------------.

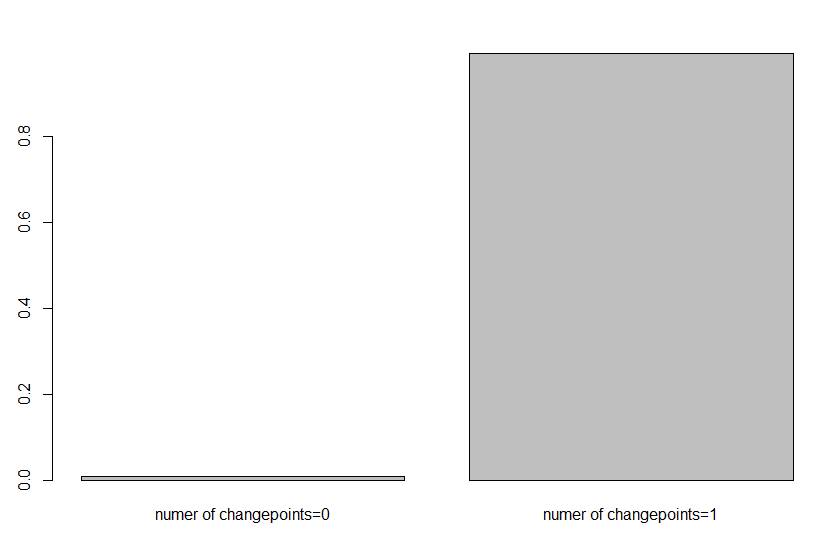
Of the two possible signal structures--no changepoint(i.e., number of changepoint (ncp)=0 ) vs 1 changepoint (ncp=1), there is strong evidence supporting ncp=1 (the posterior probability is 0.991). You can also plot it out using

 barplot(o$trend$ncpPr, names.arg = c('numer of changepoints=0','numer of changepoints=1'))

enter image description here

$\endgroup$
1
$\begingroup$

Use the temperatures to sort your data (from low to high temperatures). Then, run a test for structural breaks (e.g. cusum, or Bai-Perron) on the random numbers (as if they were a time series).

If the software you use to run the structural break tests asks you to frame your model as a regression model, then make it a regression of the random numbers on a constant only.

Under the null hypothesis that temperatures have no effect, which you want to test, the sorting has no impact on the distribution of the test statistic. Therefore any test for structural breaks provides valid inferences.

Both cusum and Bai-Perron (mentioned above) detect the breakpoint (in your case the temperature threshold) automatically, so that you do not have to pick it with a separate optimization (that would affect the distribution of the test statistic).

Here is the R code for breakpoint detection with the Bai and Perron method (apologies, I am not very familiar with R). In this example, the breakpoint is detected almost perfectly by the algorithm.

n_obs <- 4000
temperature_threshold <- 1.5
increase_if_above_threshold <- 0.5

library(strucchange)
set.seed(1)

random_numbers <- rnorm(n_obs)
temperatures <- rnorm(n_obs)

for (j in 1:n_obs) { 
  if (temperatures[j] > temperature_threshold) {
    random_numbers[j] <- random_numbers[j] + increase_if_above_threshold
  }
}

df <- data.frame(random_numbers, temperatures)
df <- df[order(df$temperature),]
row.names(df) <- NULL

results <- breakpoints(df$random_numbers ~ 1, 0.01, 1)
estimated_threshold <- df$temperatures[results$breakpoints]
print(paste0("Threshold estimated with Bai and Perron's method: ",  estimated_threshold))

And here is the code for testing the null hypothesis of absence of breakpoints:

f_statistics = Fstats(df$random_numbers ~ 1, 0.01)
test_H0_no_breakpoints = sctest(f_statistics, "supF")
print(paste0("P-value for the null hypothesis of no breakpoints: ", test_H0_no_breakpoints$p.value))

P.S.: the idea of using methods for breakpoint detection in time series to tackle non-linearities in non-time-series data is not new. It goes back at least to West, M. and J. Harrison (1997), Bayesian forecasting and dynamic models, Second Edition, Springer Verlag, New York.

$\endgroup$
2
  • $\begingroup$ As far as I understand Bai-Perron is designed to detect several structural changes. In my particular case we have either one or zero structural changes. Would it make Bai-Perron test inappropriate? $\endgroup$
    – Roman
    Commented Jul 25, 2022 at 11:14
  • 1
    $\begingroup$ You can choose to set the number of breakpoints equal to 1 as I did in the R example (for detection) and then test the null of no breakpoints vs the alternative of 1 breakpoint (also in the R example) $\endgroup$
    – user4422
    Commented Jul 25, 2022 at 11:18
1
$\begingroup$

Your question involves two tasks, estimation and significance testing.

In both cases you have uncertainties about the model (like no specification for the distribution of the "random number generator").

A way to resolve this is to use general methods. These methods work for different types of distributions, but they may not be the most efficient. (For instance, knowing more about the problem might make you choose a better cost function for training the model during fitting, such that the parameter estimates have with higher probability a smaller error)

In your case you could use isotonic regression or regression trees (restricted to a single split) to estimate the parameters and bootstrapping to determine significance.

  • Estimation of parameters

    You can use the least squares method. Fit the model such that the square of the residuals is minimised. This method is consistent: you can make your estimate as precise as desired by adding more data.

    More specifically your model can be fitted with isotonic regression or regression trees with a square loss function, and that are restricted to having a single split. For this there are many software libraries available that can help you to perform the regression.

  • Significance

    If you do not know the probability distribution of the observations, then you can not exactly compute the significance. This is because you have no information about the theoretical distribution for the performance of the estimates.

    One method would be to use ANOVA (Analysis of variance) to compare the difference between the null model (there's no jump and the mean is independent of temperature) and the alternative model (the mean jumps above some threshold temperature).

    If instead of not knowing the distribution, you would know that the distribution of the observations is Gaussian, then you could express the significance by approximating the result of the ANOVA as F-distributed. On the other hand when the distribution is not Gaussian, then possibly you might use the Gaussian distribution as an estimate, or if you suspect a large discrepancy in the distribution then you could use bootstrapping to estimate the distribution.

$\endgroup$
2
  • $\begingroup$ I wonder why you suggest isotonic regression. In my original question I have mentioned that we expect a sudden jump of mean (a step function) rather than a monotonic function. I can find the observed jump of the mean by minimization of squared deviations. This minimization obviously gives not only two means but also the split location. I do have reasons to believe that the distribution is non Gaussian. So, I need to use "bootstrapping" but I did not get how exactly should it be done in my particular case. $\endgroup$
    – Roman
    Commented Jul 25, 2022 at 11:12
  • $\begingroup$ @Roman I was thinking of a special case of monotonic regression, with only a single split. $\endgroup$ Commented Jul 25, 2022 at 17:33

Your Answer

By clicking “Post Your Answer”, you agree to our terms of service and acknowledge you have read our privacy policy.

Not the answer you're looking for? Browse other questions tagged or ask your own question.