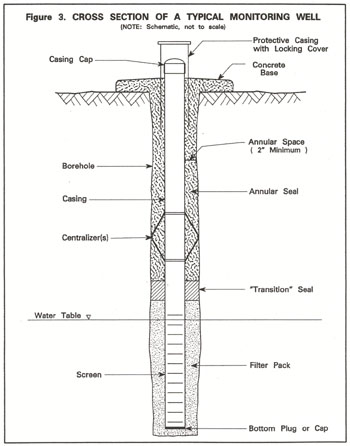
I am a Geoscientist working in the field taking groundwater measurements every day. I frequently work with groundwater monitoring wells as an integral part of my day. For those of you who do not know what a monitoring well looks like, I have included a picture here.

(source: water.ca.gov)
We use an electrical metal tape to take two measurements at each well. One for Depth to Water (DTW) and another for Total Depth (TD). This is measured in inches with decimals, eg. 4.56". These measurements are used for a wide variety of science such as potentiometric surface maps, groundwater flow direction and remediation strategies among other things.
Here is an example of a table of data that we create while gathering these measurements.
| Well ID | Depth To Water | Total Depth |
|---|---|---|
| BH01 | 4.76 | 15.58 |
| BH02 | 4.65 | 15.43 |
| BH03 | 4.00 | 15.97 |
| BH04 | 4.98 | 15.54 |
| BH05 | 5.03 | 16.00 |
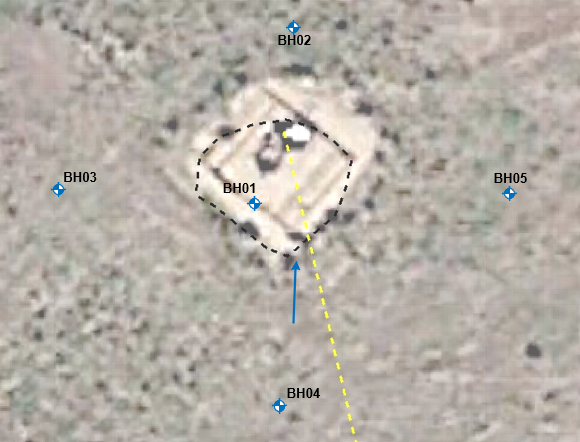
Each data set is from a site with a specific amount of wells, which can change according to the state regulations and presence of contamination. This is important because the data set for each site can grow or shrink over time. The well numbers can vary from 5 - 55 wells, each getting these two measurements every site visit. Other important information is the fact that one well can influence the measurement of another well, if water is added or drawn from a specific well, this can influence DTW at an adjacent well. Thus these wells are spatially related to one another.
Here is a fictional example that I created to illustrate what a typical site looks like.
Which brings us to the question.
- **How can I calculate the probability of getting a x.00" measurement? **
For context, for as long as I have worked at this company it has been coveted to get a DTW or TD measurement that ends in .00. It has led to many competitions, bragging rights, and debates amongst the engineers and scientists.
One school of though is that the measurement being taken is just out of 100, so x.00 happens 1/100 times. Thus the probability of getting a x.00 measurement is 1/100.
I however reject this idea, as I do not believe that the probability can be calculated that easily. For one thing there are multiple measurements per well, which increases your chances of getting an x.00. The Water levels change but typically the TD is fixed at a certain length (whatever it was drilled to). On top of that, I do no believe that these measurements come from a completely random sample, as stated above, one measurement can be related to the other both spatially and physically.
There is a plethora of data available for each site which I can use to calculate summary stats etc. My guess is that I would need to plot the current measurements in a frequency distribution and see if the measurements meet the normality assumption. If they do, then some of the common statistical tools I'm familiar with could be helpful. I keep getting stumped because I'm not interested in the continuous data, (ex. average DTW) I'm interested in a discrete event that occurs during measurement events and the frequency at which it occurs.
Any guidance on how to calculate this probability would settle years long office debates, and offer a new scientific tool to wield in the coveted chase to get a x.00. I am happy to provide more information or data as needed, and I am grateful to anyone who reads this post and has decided to answer.

