1
$\begingroup$

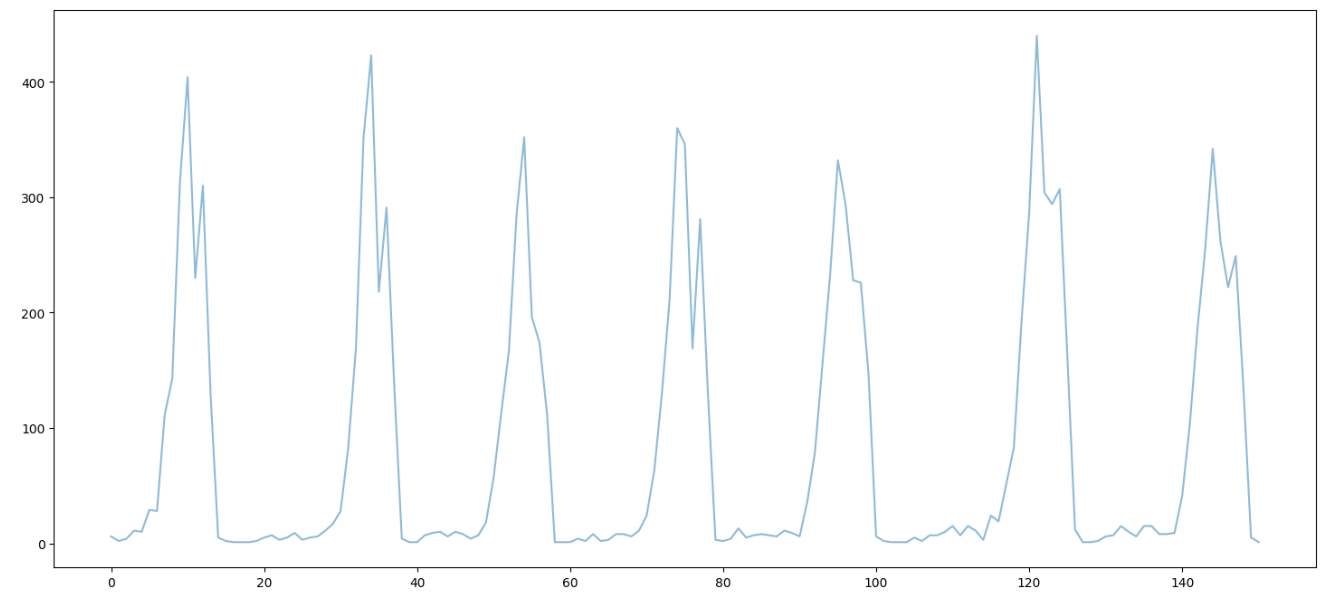
I have a time series which has sequence as follows

enter image description here

Upon eye balling this series , it sounds me a series which has 20 cycles where frequency/counts of event increase from 0 and then decrease after half of its cycle.

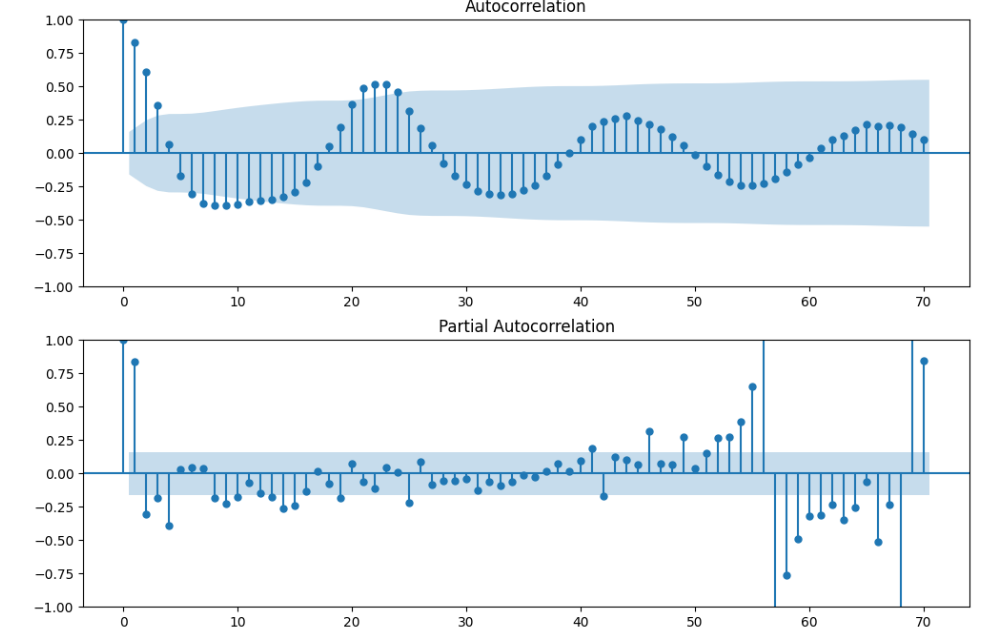
I generated ACF and PACF plot of this series without any transformation (log or differencing)

enter image description here

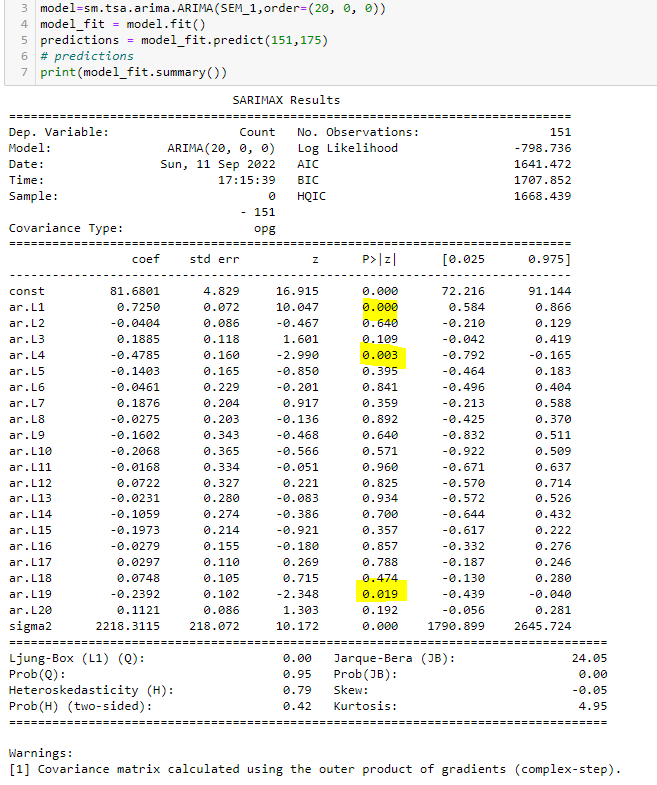
I am not getting any insights from this ACF and PACF plot for AR and MA order. However , based on my intuition I used 20 AR order for building model without any differencing and MA order

enter image description here

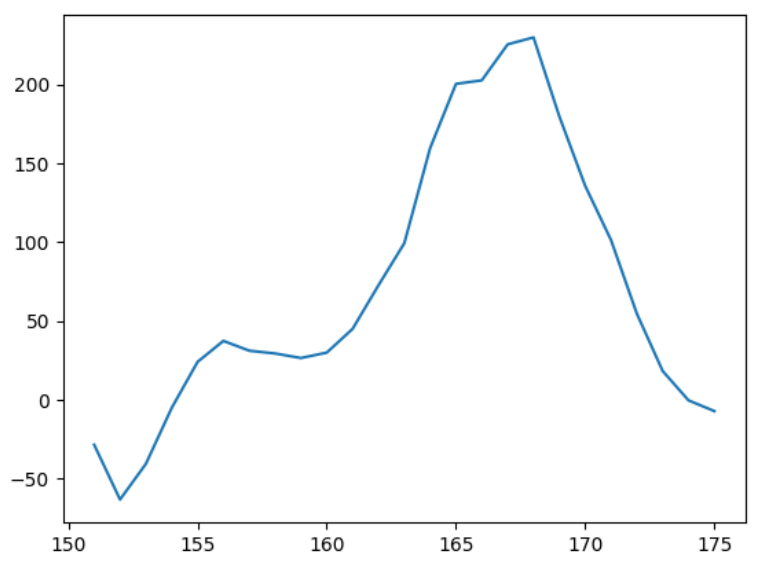
as in model summary lag 1, lag 4 and lag 19 are more significant as they have less than 0.05 value. However , I am going with all 20 lags and forecast for the next period from 151 to 175

enter image description here

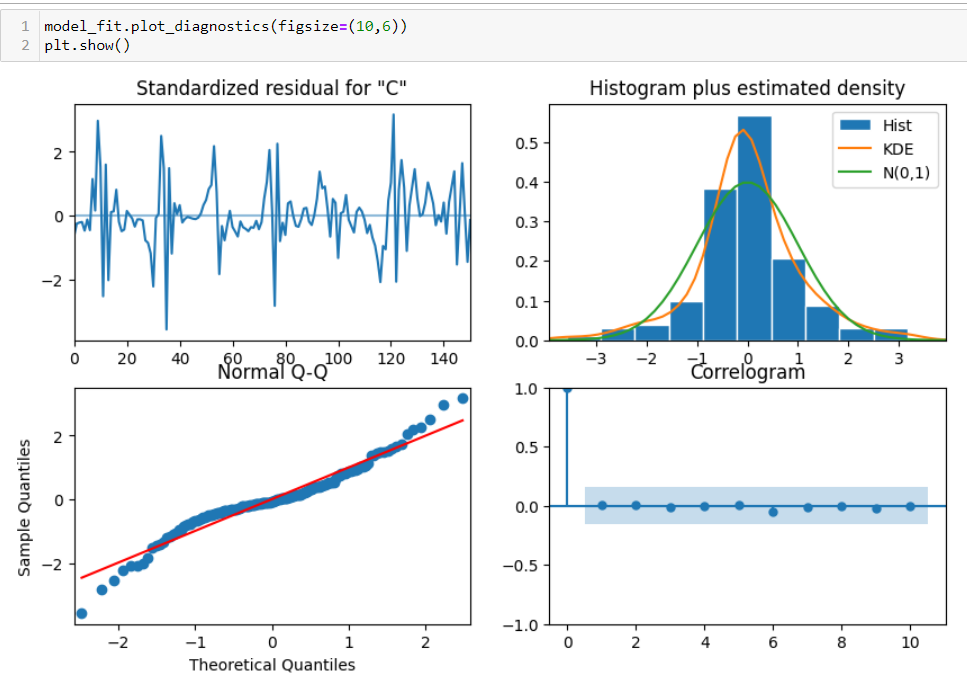
When I check residual plots autocorrelation 4th plot, it does not tell me there is any more improvement required for the model

enter image description here

This model giving me almost same cycle and overall more or less same number counts estimated for this forecasted period from 151 to 175.

My confusions are

Can I go with this model for live deployment forecasting?

Why model does not give same number of forecasted counts upon reducing the number of lags, it works best with 20 but when I start to decrease from 20 to 15 or 10 then model forecasting is not expected what business wants?

How can I find AR and MA order for the model using PACF and ACF plot?

$\endgroup$

1 Answer 1

2
$\begingroup$

From your plots it appears that you might have a series with a periodic signal in it. The best way to check this is to look at the Fourier intensity of the time-series, which you can do using the intensity function in the ts.extend package. (In the present case it would be best to look at the Fourier intensity of the log-data. If you see clear spikes in the Fourier intensity then this shows that you have a periodic signal. Typically if you have a time-series with a periodic signal, you would begin your modelly using a regression model with sinusoidal terms and you would add enough terms to capture the periodic component adequately. You would then examine the residual component from this model using diagnostic plots and tests and refine your model accordingly. You should note that AR models do not give you signals with a fixed period, so they are usually not ideal for periodic time-series data.

$\endgroup$
2
  • $\begingroup$ this is not fixed period it varies between 17 to 25. Any reason why AR does not give signals with fixed period? I have not come across or read any caveats like that about AR model. $\endgroup$
    – user172500
    Commented Sep 12, 2022 at 5:14
  • 1
    $\begingroup$ An auto-regressive part in a model is stochastic, so it can create waves in the time-series, but those waves don't occur at regular intervals. Contrarily, when we model a time-series using periodic regression, the periodic terms are fixed and we merely need to estimate the relevant period, amplitude, etc. It is possible to construct models for periodic signals with varying periods, but these are a bit more complex. $\endgroup$
    – Ben
    Commented Sep 12, 2022 at 8:01

Your Answer

By clicking “Post Your Answer”, you agree to our terms of service and acknowledge you have read our privacy policy.

Not the answer you're looking for? Browse other questions tagged or ask your own question.