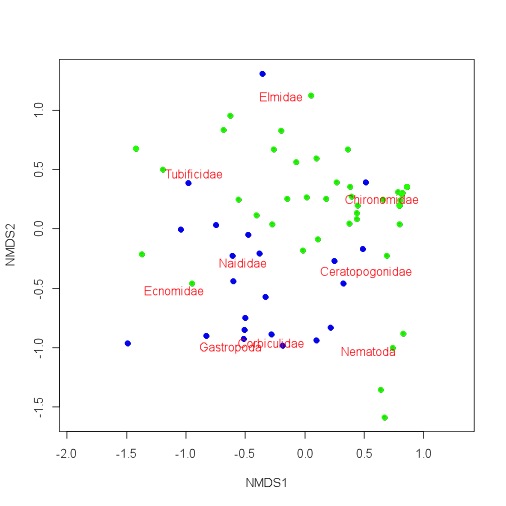
I am doing an NMDS ordination. The data come from a number of sites scattered around two lakes. In the plots, I coloured the samples from the two lakes blue and green. There seems to be some pretty decent separation between the lakes in the NMDS ordination plot. However, when I use lakes as a factor variable with envfit, I only get an R squared value of 0.19 (although the pvalue was less than 0.001). The R squared value is way lower than I thought. Am I missing something or am I reading too much into this? 
1 Answer
Let me take a crack. I believe factorfit finds average ordination scores for each level of your factor (and places an arrowhead), and performs a regression (with goodness of fit)... Although it appears that you have separation due to your factor in nMDS space, the R^2 is likely low simply due to high variance in ordination score around an expected regression score. This could simply be due to other variables that you include in your nMDS ordination, and if you only included [species] important to the distinction between habitat, your R^2 would of course go up. Remember that the axes in nMDS are not linear combinations of descriptors... Thus points are arranged by similarity in k-dimensions, and not according to scores of any specific variable.

envfitis or does. But whatever you are doing, the impression is that you are surprised that one predictor has only a moderate R^2. The answer seems to be as much ecology as statistics, namely that you surely have many variables at play in your system and you don't really expect one to dominate, unless that's part of your design. Otherwise put, are you surprised that everything but lakes accounts for 0.81? $\endgroup$envfitcalculates R^2 matches the pattern of difference between the lakes. There are lots of misses as well as hits from any simple discrimination. I haven't tried finding out aboutenvfit. $\endgroup$NMDS1andNMDS2? Also, commenting on @NickCox's first comment, I think an R^2 value of 0.2 for one covariate is actually very decent. Also note that R^2, which measures deviation from the fitted mean, can be unrepresentative in terms of separating groups. E.g. suppose the fiited mean of one group is 10000 and the other is 100. Even with a lot of variation, you will be able to separate these two groups easily. $\endgroup$