I'm trying to determine if the exponential distribution is a good model for a data set that I'm exploring. It doesn't have to be precise. I'm using the data for capacity planning (if it's a good fit) and for my own learning. I found a data set that I have ready access to and I wanted to test to see it fit a known distribution.
To test if it is a good fit, I've generated 2 plots from a data set with about 1.5M entries.
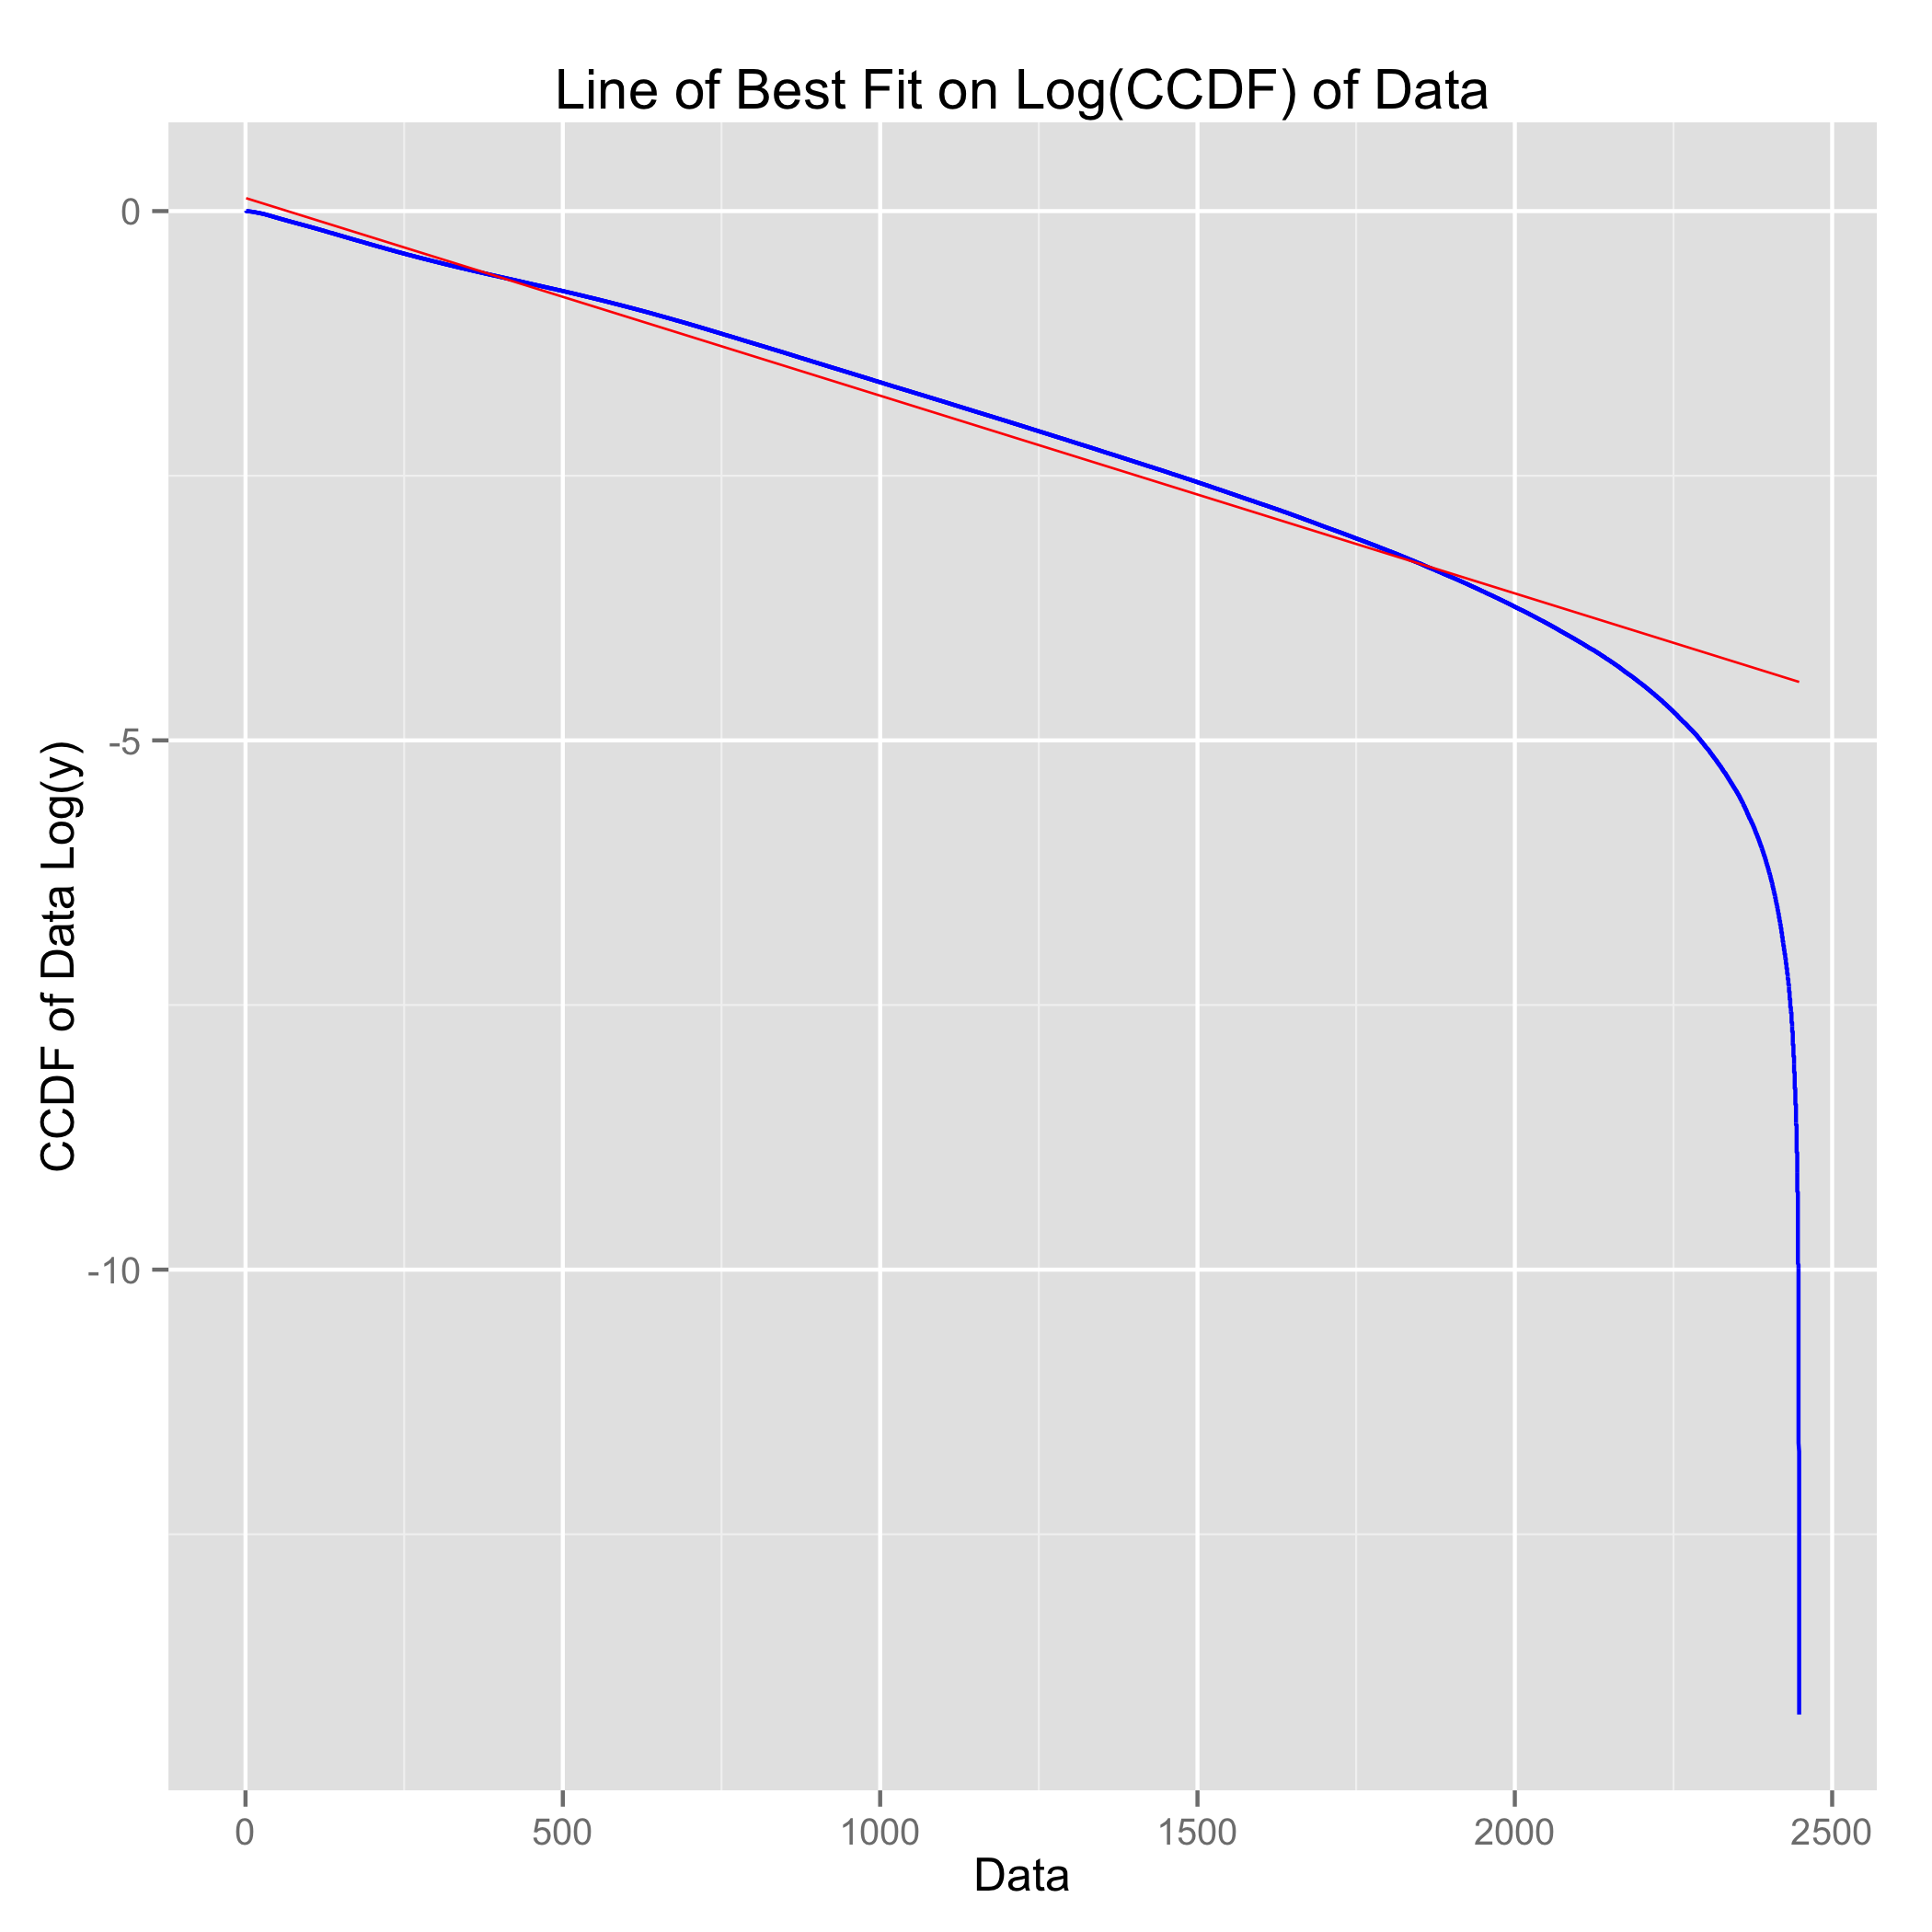
In the first plot, I take the data and generate an empirical CDF and plot the log of the CCDF and the linear model using geom_smooth. I'm doing this because if it is exponential (y ~= e^−λx), then the log of both sides gives log y ~= -λx which should be a straight line with slope -λ.
data <- sort(data)
valid <- data[1:(length(data)*0.96)]
ecdf <- (1:length(valid))/length(valid)
df <- data.frame(cbind(x=valid, y=ecdf))

# if this is exponential, get the slope and the x intercept
lm(log(1-y)~x, data=df, subset=seq(1,length(valid)-1))

ggplot(aes(x=x, y=log(1-y)), data=df[1:length(valid)-1,]) +
    geom_line(color="blue") +
    geom_smooth(method="lm", color="red", size=0.3) +
    labs(x="Data", y="CCDF of Data Log(y)", title="Line of Best Fit on Log(CCDF) of Data")
Here is the result. It mostly fits except at the tail. Should I conclude that the exponential distribution is a (mostly) good fit?

Edit: here is the summary data from the model generated by lm for the Log(CCDF) plot:
Residuals:
    Min      1Q  Median      3Q     Max
-9.7550 -0.0750  0.0044  0.1171  0.1328

Coefficients:
              Estimate Std. Error t value Pr(>|t|)
(Intercept)  1.239e-01  2.388e-04   518.8   <2e-16 ***
x           -1.868e-03  2.989e-07 -6248.6   <2e-16 ***
---
Signif. codes:  0 ‘***’ 0.001 ‘**’ 0.01 ‘*’ 0.05 ‘.’ 0.1 ‘ ’ 1

Residual standard error: 0.1907 on 1473365 degrees of freedom
Multiple R-squared: 0.9636,     Adjusted R-squared: 0.9636
F-statistic: 3.904e+07 on 1 and 1473365 DF,  p-value: < 2.2e-16
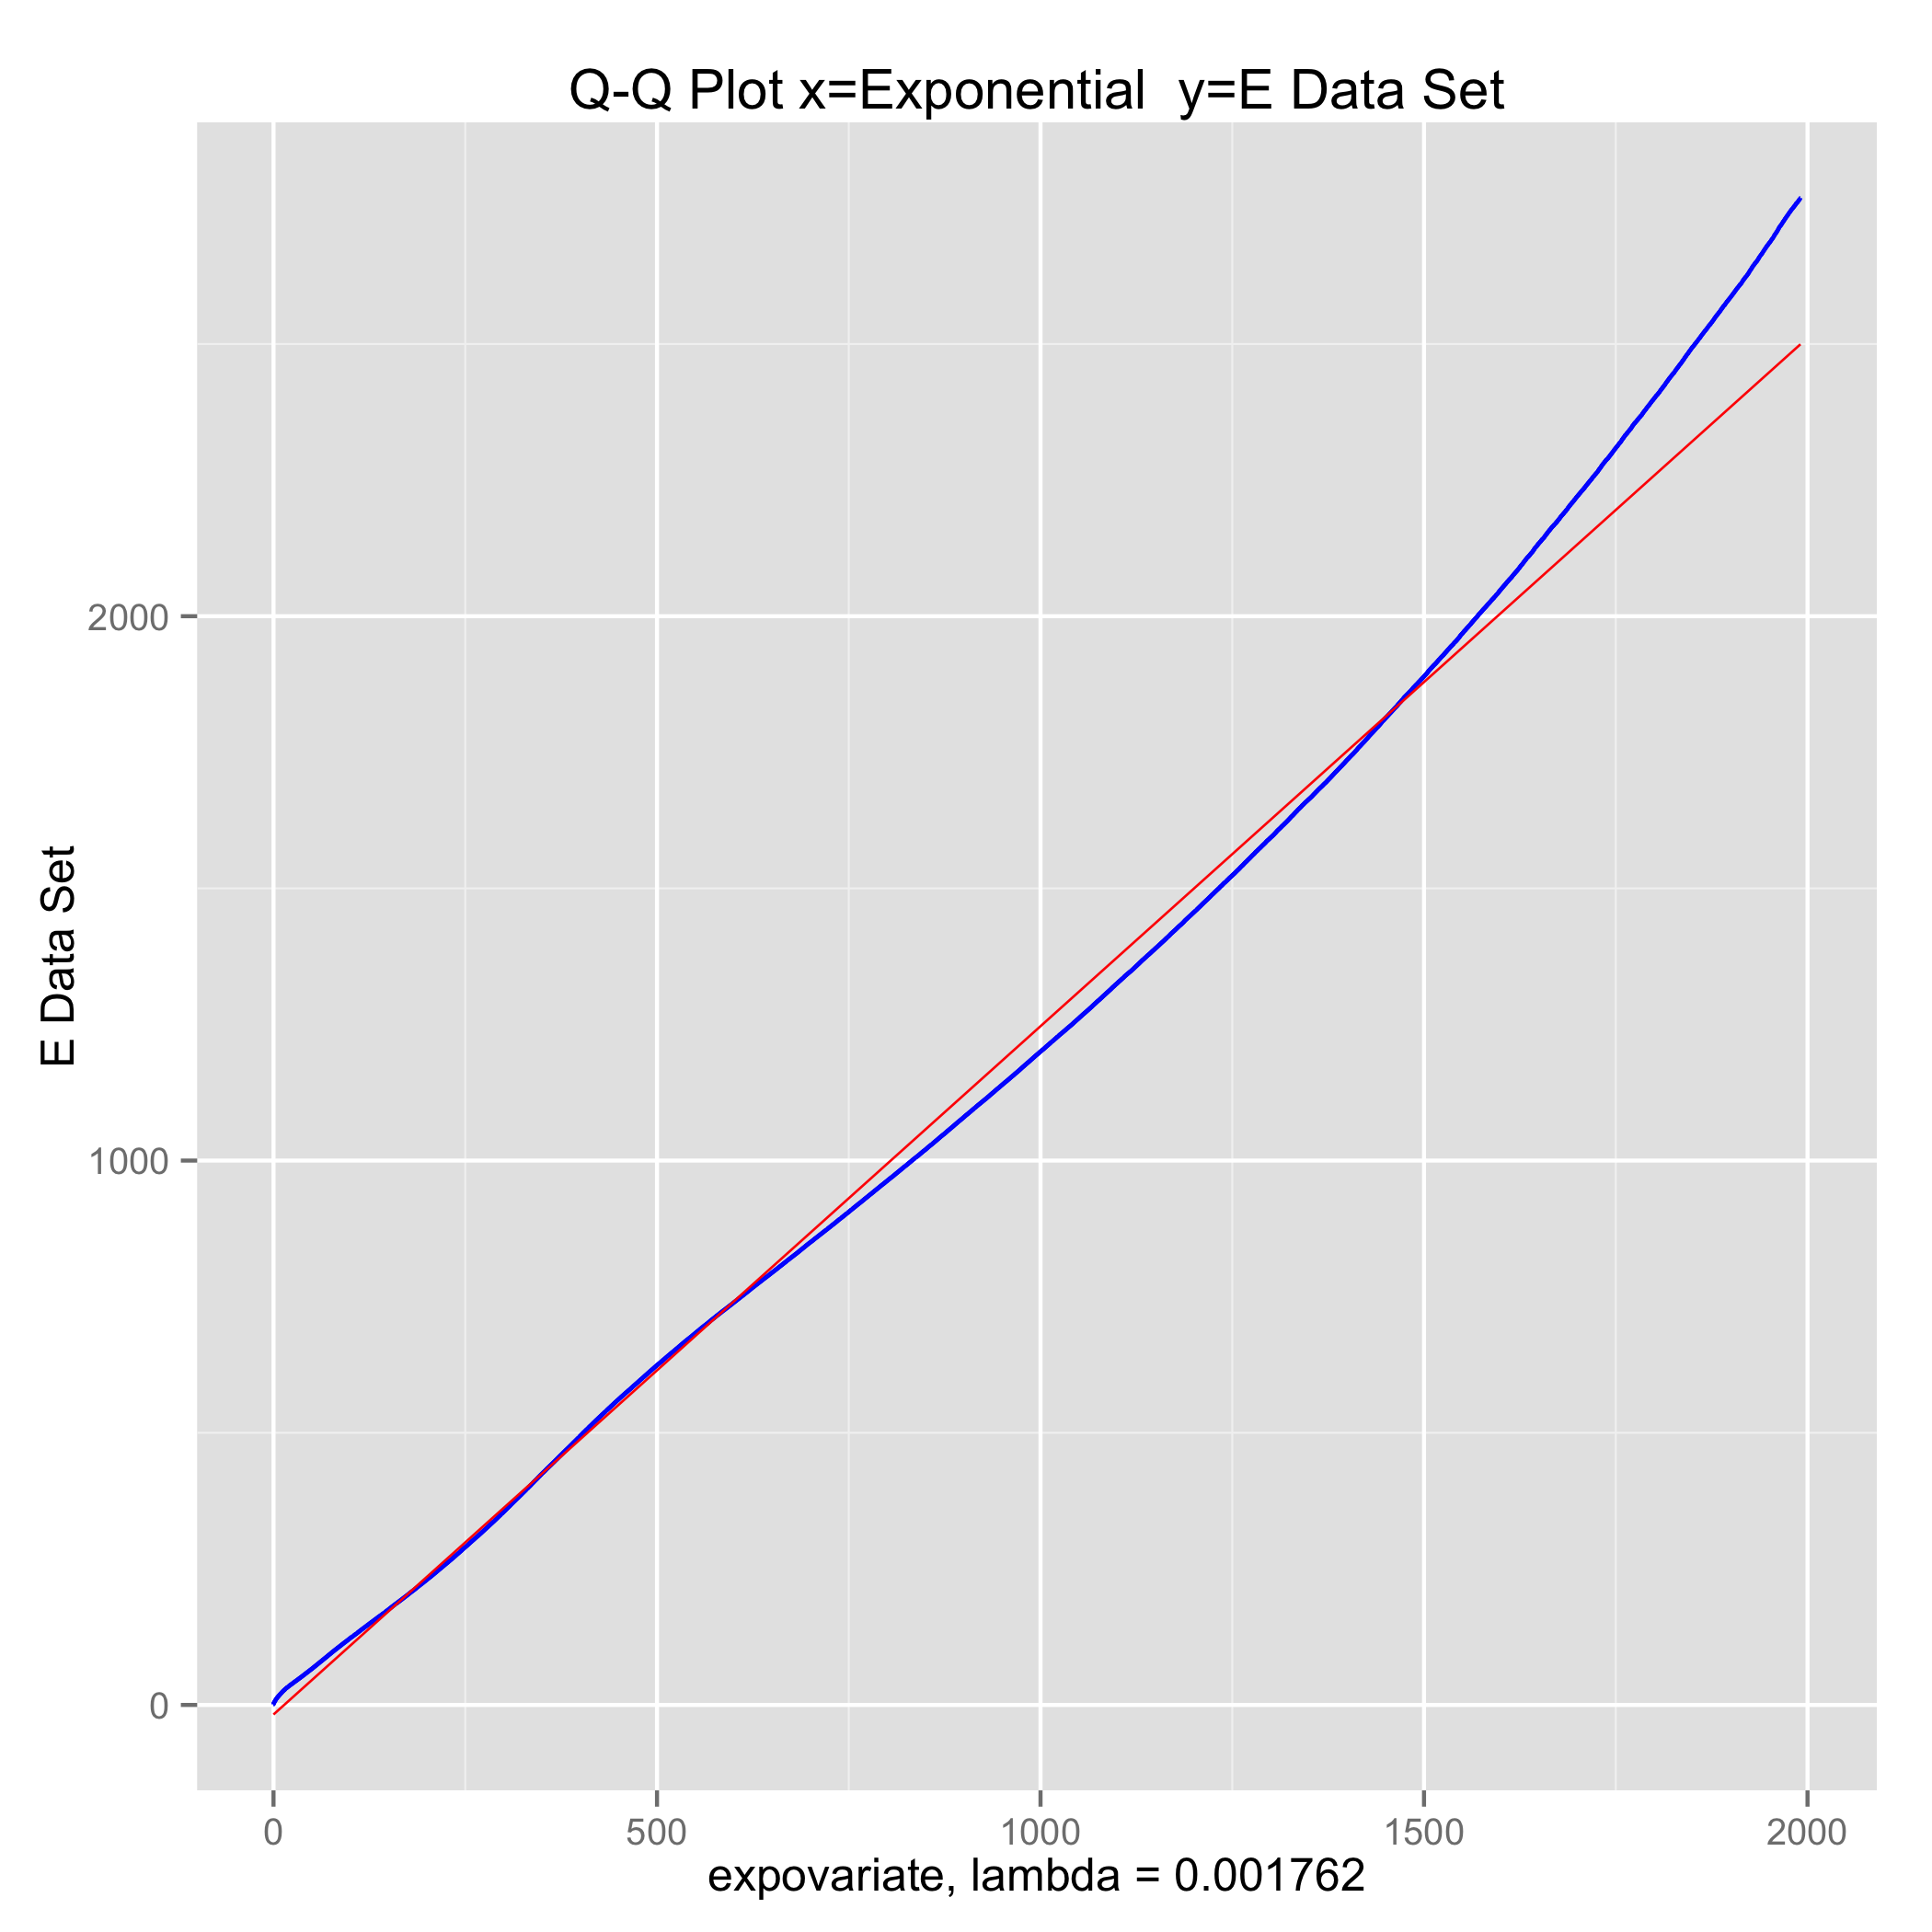
Next I attempted to generate a Q-Q plot by generating a data set that is the same size as the empirical data set (about 1.5M) using a function that generates random numbers from an exponential distribution. From the lm above I used the x output and switched the sign as my lambda. I sorted both of them and plotted the sampled data as x and the empirical data as y.
Here is the result. Again, it's not quite x=y. Should I conclude that the exponential distribution is a good enough fit?

Edit: here is the summary data for the model from the Q-Q plot as generated by lm.
Residuals:
    Min      1Q  Median      3Q     Max
-49.256  -9.214  -0.069  10.060 268.769

Coefficients:
              Estimate Std. Error t value Pr(>|t|)
(Intercept) -1.757e+01  4.086e-02  -429.9   <2e-16 ***
x            1.264e+00  6.078e-05 20803.7   <2e-16 ***
---
Signif. codes:  0 ‘***’ 0.001 ‘**’ 0.01 ‘*’ 0.05 ‘.’ 0.1 ‘ ’ 1

Residual standard error: 32.82 on 1488715 degrees of freedom
Multiple R-squared: 0.9966,     Adjusted R-squared: 0.9966
F-statistic: 4.328e+08 on 1 and 1488715 DF,  p-value: < 2.2e-16
Thanks everyone for all of the helpful comments!
