1
$\begingroup$

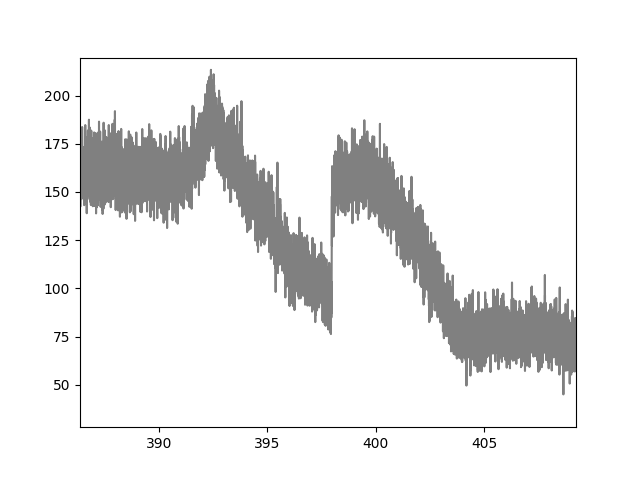
I have some time-series data sets in which, in principle, two types of event are possible: the signal can instantaneously jump up or down; or there can be a gradual decrease in the signal. I want to detect the regions featuring only the gradual decreases, without detecting the large jumps in signal strength. Below is an example of this, showing: one gradual decrease of interest from ~392-398 s; a jump back at ~398 s; a pause from ~398-400 s; and a second gradual decrease of interest from ~400-404 s.

an image of a sample data set, showing one gradual decrease of interest from ~392-398 s; a jump back at ~398 s; a pause from ~398-400 s; and a second gradual decrease of interest from ~400-404 s

So far, I have tried various methods to pick out these features, including low-pass filters and matched filters, but I've struggled to get something with enough fidelity to mark the start and end-points accurately. I think the matched filter was the closest I've got, but since I'm only looking for a slight change in gradient of the data the filter wasn't sufficiently discriminatory.

My question is similar to that in the thread here, but a) I specifically want to filter out quick changes, unlike in that question; and b) the question there was closed without an answer because the question had insufficient detail, so I'm trying my own here.

$\endgroup$
2
  • $\begingroup$ Can you provide the data for plot which is shown? That would allow someone to take a proper crack at it $\endgroup$
    – Jon Nordby
    Commented Dec 31, 2022 at 22:22
  • $\begingroup$ There also looks to be a gradual increase before the first decrease. How should that be handled? $\endgroup$
    – Jon Nordby
    Commented Dec 31, 2022 at 22:31

1 Answer 1

0
$\begingroup$

Bit late, but you never know. I am currently looking at some time series data and had a similar issue, I recommend looking at some jump detection arrival time literature.

-Lee, S. S. & Mykland, P. A. (2008), ‘Jumps in financial markets: A new nonparametric test and jump dynamics’, The Review of Financial Studies 21(6), pp. 2535–2563. http://dx.doi.org/hhm056.

The above provides a nice real time method that works fairly well, with implementation described nicely here:

-Maekawa, K. & Lu, X. (2012), ‘Two tests for jumps in high frequency financial time series : Simulation and empirical application’, HUE Journal of Economics and Business 35(1), pp. 11–20. Available at: https://cir.nii.ac.jp/crid/1050577232667486464

I hear there is also a nice method by Christensen along with their work on drift bursts but I'm not entirely sure. These tests are designed to work with financial data but will likely work with any other time series data with a variance that can be modeled by a stochastic process and possibly more.

Edit: I should clarify, by detecting the arrival time of the jump, you can look for changes while excluding the points at which you know a jump to exist. For a high jump density with reasonably sized jumps the test had ~80% detection rate, which isn't ideal but for my use case was acceptable.

$\endgroup$

Your Answer

By clicking “Post Your Answer”, you agree to our terms of service and acknowledge you have read our privacy policy.

Not the answer you're looking for? Browse other questions tagged or ask your own question.