4
$\begingroup$

I am trying to measure the similarity between two signals, i.e. how identical they are. A complete overlap (two lines forming a single line) should give me a value of 1, the greater the distance, between the lines and the less similar the overall trend, the closer the value should go to 0.

I have tried measuring standard deviation $\sigma$ and different variants of correlation $r$ using MATLAB functions std(), xcorr() and corr2(). They did not do the trick, as ,e.g. $\sigma_{\phi_{A}}$ was $>$ than $\sigma_{\phi_{B}}$ (see figure below).

I was thinking about using some sort of weighted average between $\sigma$ and $r$. Another possibility would be to measure the difference between areas under the curves (but then different intersecting graphs could have the same area).

There are related questions to this, but they are either: (i) discussing the generic concept of similarity or (ii) suggest using xcorr() (different variants of which did not work for me).
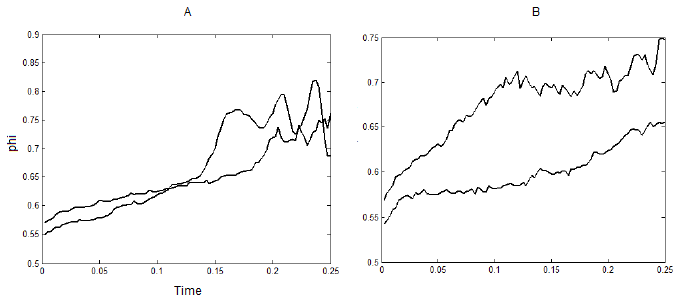
Link to an image of two signals

$\endgroup$

2 Answers 2

4
$\begingroup$

One obvious thing to do would be to use the L2 distance between the two curves, and then transform it to get the range you want:

$distance(f_1,f_2)=\frac{1}{1+\|f_1-f_2\|_{L^2}}$

However, like you say, the issue of determining what you mean by 'similar' curves is not a simple problem. In fact, using the $L^2$ distance has issues in that it leads to very low 'prediction power' due to the curse of dimensionality.

Have a look at this paper (it is very readable) for some nice simple examples: Link

$\endgroup$
2
  • $\begingroup$ Thank you. The L2 norm seems to be working. It would have been nice to see some discussion of why other methods were not suitable. $\endgroup$ Commented Jun 4, 2013 at 13:49
  • $\begingroup$ I can't speak authoritatively about the particular things you tried, so won't try to (very interested to read an answer from someone who can!). As general comment though, they probably weren't suitable because they didn't match what you were imagining as describing 'similar' curves. I'd again suggest the paper I've linked to, it does a really nice job of explaining this. $\endgroup$ Commented Jun 4, 2013 at 23:17
0
$\begingroup$

Use Dynamic Time Warping if your signals are not too long. DTW is used in various fields like signature matching and speech recognition.

Download MATLAB's DTW library here.

$\endgroup$
1
  • 2
    $\begingroup$ Can you elaborate on how DTW works & why it would be a solution for the OP? $\endgroup$ Commented May 7, 2015 at 22:59

Your Answer

By clicking “Post Your Answer”, you agree to our terms of service and acknowledge you have read our privacy policy.

Not the answer you're looking for? Browse other questions tagged or ask your own question.