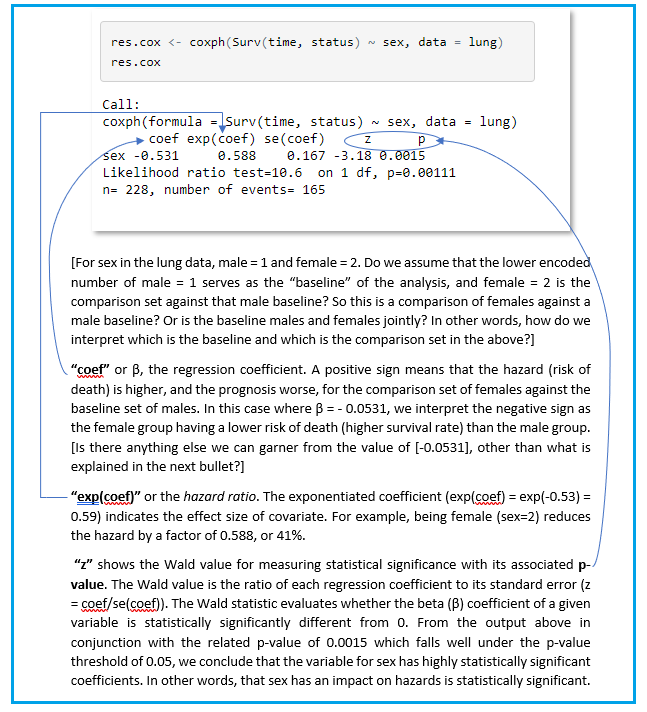
I have begun studying survival analysis and am using R packages survival and survminer. Verbal descriptions of statistical concepts can be “sloppy” and I’m trying to understand these concepts using crystal-clear language. I’ve worked through a Cox Proportional Hazards model example using http://www.sthda.com/english/wiki/cox-proportional-hazards-model using univariate Cox regression and the lung cancer data provided in the “lung” dataset of the survival package. I am trying to interpret the coxph() output as illustrated below. Are my interpretations shown below, correct? And as asked below in brackets, how does one tell which variable is used as the baseline and which is the comparison variable? How can you tell from the below coxph() output that it is the female sex variable with the lower hazard rate?
1 Answer
The interpretation of coefficients depends on how the predictor variables are coded. In this example, with male = 1 and female = 2, the software will assume that the values are numeric.
On that basis, the coefficient for sex will be just what you would have for a continuous numeric predictor variable: the change in log-hazard per unit increase in the "numeric" sex variable. With only 2 possible values of the "numeric" sex variable, that unit increase is for the change from male to female. That's equivalent to having male as the reference level, and the coefficient being the extra log-hazard associated with female.
As comments suggest, you can resolve any ambiguity by explicitly coding sex as a factor. That allows you to choose the reference level. The R default when reporting coefficient values in that case is to append the specific non-reference level to the overall predictor name.
Even in that case, however, you have to be careful. The default "treatment" or "dummy" coding of factors in R is to treat the first level as the reference/baseline. I recall that SPSS (or some other software that I don't use) treats the last level as the reference instead. Also, even within R, you can choose different types of coding for categorical predictors that will affect the interpretation of coefficients.
-
$\begingroup$ That works, and when running
coxph(formula = Surv(time, status) ~ as.factor(sex), data = lung), while leaving the sex variables as numerics, the output correctly specifies that the coefficients et al apply to code = 2 for female; thus, it is made clear that female in this case is the comparison and male the baseline. $\endgroup$ Commented Mar 11, 2023 at 16:27 -
1$\begingroup$ @Village.Idyot for completeness, your interpretations are OK. Be careful with terminology; "univariate" is now typically used to describe a single type of outcome, not a single predictor, with "multivariate" meaning different types of outcomes. I will, however, confess to having used "multivariate" to describe a multiple-predictor model in at least one publication. $\endgroup$– EdMCommented Mar 11, 2023 at 16:40
-
$\begingroup$ Thanks! Are there terms currently in use for single and multiple predictors, respectively? In lieu of univariate/multivariate I used in my OP? $\endgroup$ Commented Mar 11, 2023 at 16:51
-
$\begingroup$ @Village.Idyot "single-predictor" versus "multiple-predictor" in general or, in the regression context with multiple predictors, "multiple regression." $\endgroup$– EdMCommented Mar 11, 2023 at 16:54


Call: coxph(formula = Surv(time, status) ~ sex, data = lung)with no indication of which is the baseline set and which is the comparison set. $\endgroup$lung$sex=ifelse(lung$sex==1,"male","female")and then fit the model again usingcoxph(formula = Surv(time, status) ~ as.factor(sex), data = lung)(as.factor might not even be needed) and just see what you get $\endgroup$as.factor()isn't needed; also, the output row name is a little cleaner without usingas.factor(). Note that this makes the female subset the baseline and the male subset presented as the comparison in the output. $\endgroup$