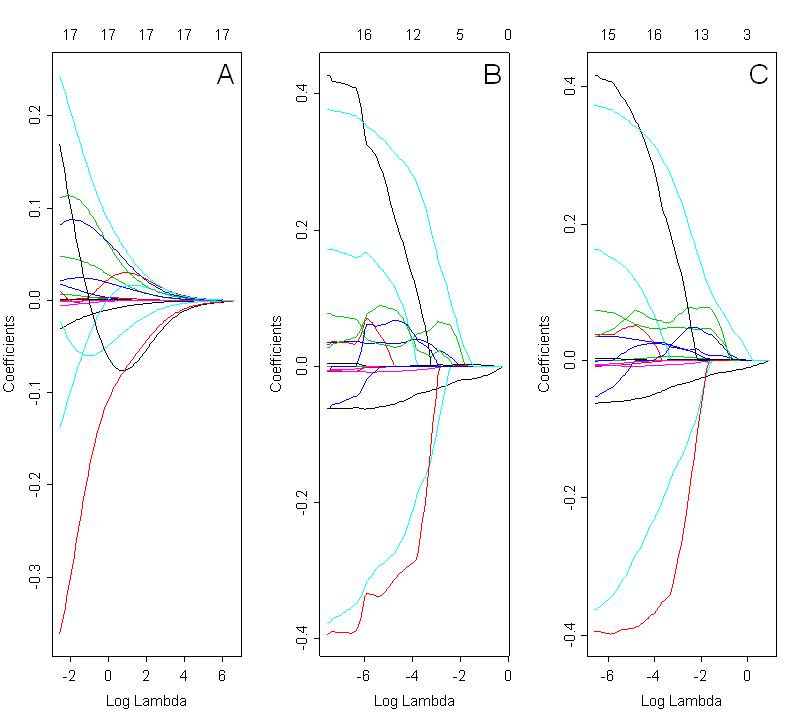
I would like to compare models selected with ridge, lasso and elastic net. Fig. below shows coefficients paths using all 3 methods: ridge (Fig A, alpha=0), lasso (Fig B; alpha=1) and elastic net (Fig C; alpha=0.5). The optimal solution depends on the selected value of lambda, which is chosen based on cross validation.

When looking at these plots, I would expect the elastic net (Fig C) to exhibit a grouping effect. However it is not clear in the presented case. The coefficients path for lasso and elastic net are very similar. What could be the reason for this ? Is it just a coding mistake ? I used the following code in R:
library(glmnet)
X<- as.matrix(mydata[,2:22])
Y<- mydata[,23]
par(mfrow=c(1,3))
ans1<-cv.glmnet(X, Y, alpha=0) # ridge
plot(ans1$glmnet.fit, "lambda", label=FALSE)
text (6, 0.4, "A", cex=1.8, font=1)
ans2<-cv.glmnet(X, Y, alpha=1) # lasso
plot(ans2$glmnet.fit, "lambda", label=FALSE)
text (-0.8, 0.48, "B", cex=1.8, font=1)
ans3<-cv.glmnet(X, Y, alpha=0.5) # elastic net
plot(ans3$glmnet.fit, "lambda", label=FALSE)
text (0, 0.62, "C", cex=1.8, font=1)
The code used to plot elastic net coefficients paths is exactly the same as for ridge and lasso. The only difference is in the value of alpha. Alpha parameter for elastic net regression was selected based on the lowest MSE (mean squared error) for corresponding lambda values.
Thank you for your help !
