7
$\begingroup$

I am using Libsvm for Matlab.

I would like to construct the model for a full circumscription of all training data (in the higher SVM-space). For this I assume all my training data is correct and has no outliers.

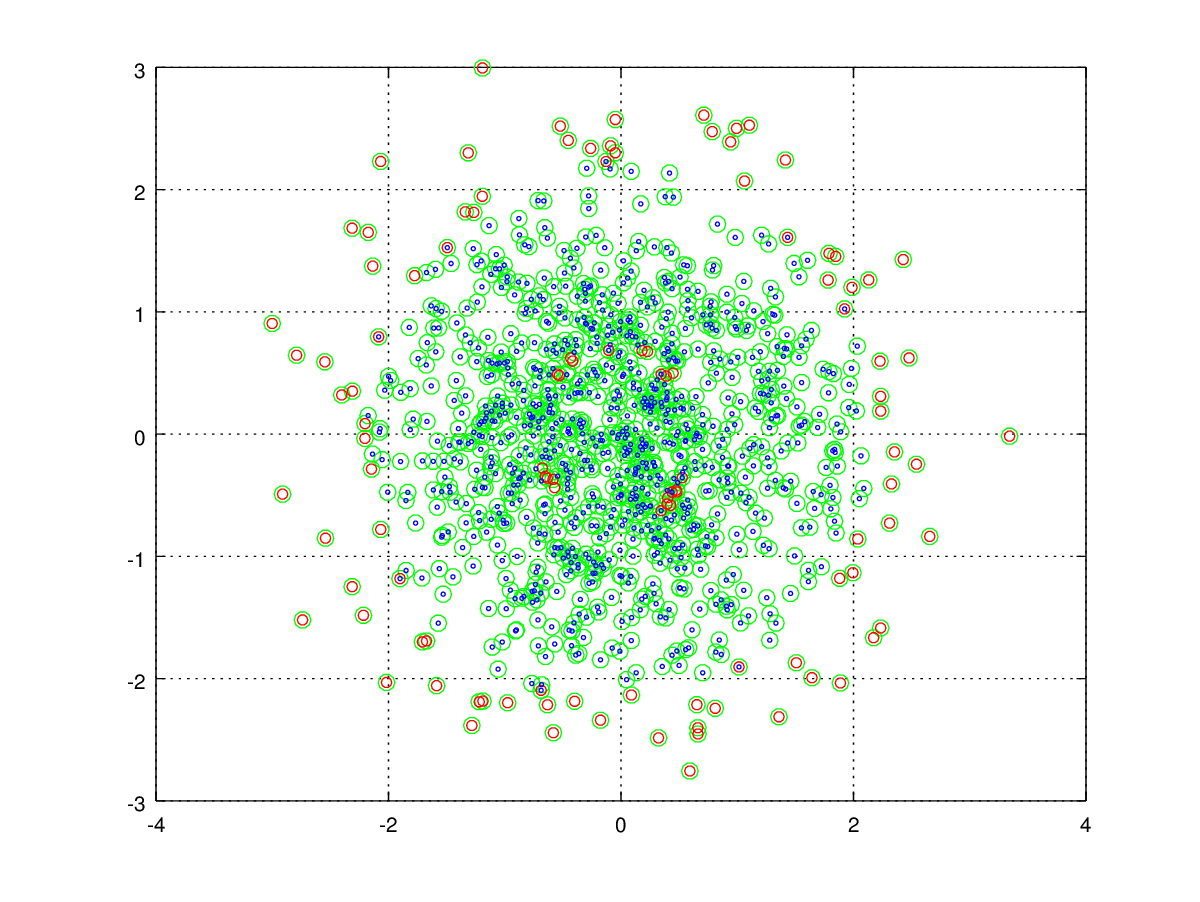
I generate random distributed data (which is likely to resemble my real-world data) and train an one-class SVM for it. When I predict the labels of that same data almost all the data points that are used as Support Vector are also considered to be outside the class. Is that correct behavior?

How can I construct a model for a SVM which considers all data to be in-class?

The following code gives an example. In the resulting scatterplot the blue circles are all the data points, the reds are support vectors used by the model and the green circles are for points that are outside. So, the empty red circles are support vectors but out-of-class.

I have tried to adjust the nu parameter (-n 0.5 as default), but that only changes the ratio of data points / support vectors. The support vectors are still most out-class.

data = normrnd(0,1,1000,2);
labels = ones(length(data),1);

% Construct one-class SVM with RDF kernel (Gaussian)
model = svmtrain(labels, data, '-s 2 -t 2');

% Use the same data for label prediction
[predicted_labels] = svmpredict(labels, data, model);
inside_indices = find(predicted_labels > 0);

figure; hold on;
% Scatterplot of all data, blue circles
scatter(data(:,1), data(:,2), 30, 'blue');

% Scatterplot of all support vectors, small red circles
scatter(model.SVs(:,1), model.SVs(:,2), 20, 'red');

% Scatterplot of all data inside the one-classs, small green circles
scatter(data(inside_indices,1), data(inside_indices,2), 10, 'green');

The resulting scatterplot: scatterplot example
Edit: I may have found a solution; the LIBSVM Tools contains an extension for "Support Vector Data Description", for "finding the smallest sphere containing all data": http://www.csie.ntu.edu.tw/~cjlin/libsvmtools/#libsvm_for_svdd_and_finding_the_smallest_sphere_containing_all_data

Edit2: Using the SVDD tool does make make any difference. I train with -s 5 but still I only get around 50% accuracy for the same data set.

My question still holds; How can I describe all data with an one-class SVM?

$\endgroup$
6
  • $\begingroup$ Did you try increasing the bandwidth parameter of your kernel? $\endgroup$ Commented Jun 6, 2013 at 14:06
  • $\begingroup$ I'm not sure, but I think the bandwidth parameter is -g? The docs say "-g gamma : set gamma in kernel function (default 1/num_features)". When I set it to -g 0.000000001, the accuracy becomes 95%. But that does not seem the correct way to me, is it? $\endgroup$
    – Roemer
    Commented Jun 6, 2013 at 14:17
  • $\begingroup$ When I use the SVDD version (-s 5) the best results seem to be with -g 1, but it differs very much. $\endgroup$
    – Roemer
    Commented Jun 6, 2013 at 14:19
  • $\begingroup$ Yes the bandwidth parameter is -g, but g is the inverse of bandwidth that is g = -1/2(bandwidth^2). Therefore, increasing bandwidth means using smaller g. What you observe is the expected behaviour ( jmlr.org/papers/volume7/vert06a/vert06a.pdf ). How well SVM performs is very much dependent on the kernel choice and its parameter settings. 1/num_features is a great choice if your features have values in the range [0,1], otherwise you will have to change your bandwidth accordingly or normalize your input to be in [0,1]. $\endgroup$ Commented Jun 7, 2013 at 2:01
  • $\begingroup$ why did you use the same dataset as training set ? Did you test with different datasets with two classes data $\endgroup$
    – Mark.M
    Commented Oct 31, 2013 at 11:14

4 Answers 4

2
$\begingroup$

If you set the nu parameter to very small (-n 0.001) and set the gamma to small as well (-g 0.001) you will get almost all your training data being in your class.

$\endgroup$
0
1
$\begingroup$

I tried your code. For one-class-SVM, the penalty determined by a parameter nu. The default value is 0.5. That is what gives you this plot. If you set it to be 1, all the points are classified as one class. Setting C does not affect the output because C is not relevant to one-class-SVM.

$\endgroup$
0
$\begingroup$

I know it's a bit late but anyway my contribution to your question is this:

You are using a gaussian kernel to train your one-class svm. This may mislead you for making deductions about the support vectors presence. If you just modify your example and use a linear one-class svm (always better explained in linear case) you will see that your sv are equally distributed in all the space. (I am not suggesting that linear is the best choice, just that are more straight forward to be be explained).

As you have defined your question is that all the data points that are used as Support Vector are also considered to be outside the class so your concern is why the majority of sv is outside your class? My guess is that your data is quite dense and in the attempt to model the boundary a lot of your outliers are required for this task. If you make another experiment with sparser data I think that wont be such a problem.

$\endgroup$
0
$\begingroup$

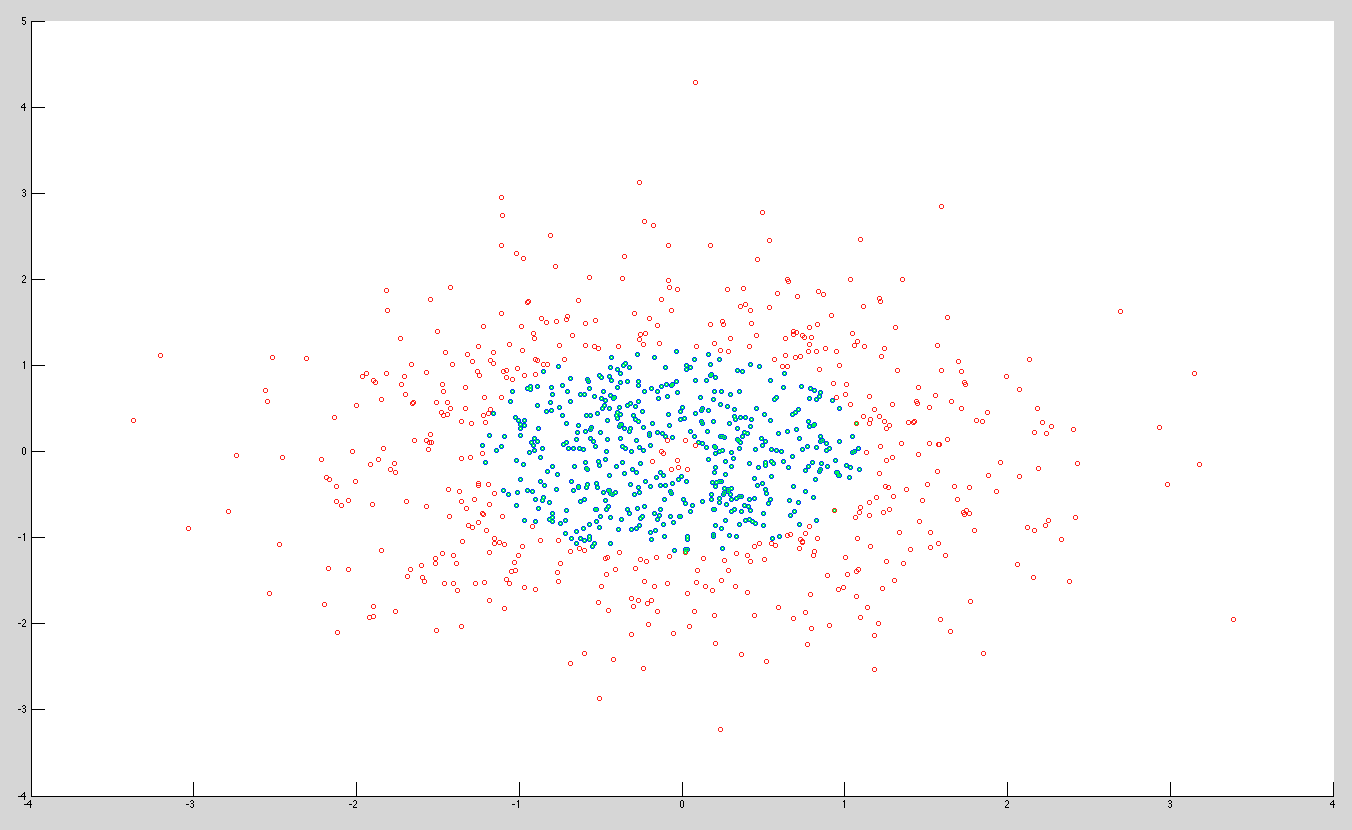
nu=0.1

I changed the colors:

green -> training set,

red-> SV,

blue->in class data

Also I added the nu value into svmtrain parameters

model = svmtrain(labels, data, '-s 2 -t 2 -nu 0.1');

optimization finished, #iter = 484
obj = 723.098765, rho = 15.666491
nSV = 112, nBSV = 88
Accuracy = 90% (900/1000) (classification)
$\endgroup$

Your Answer

By clicking “Post Your Answer”, you agree to our terms of service and acknowledge you have read our privacy policy.

Not the answer you're looking for? Browse other questions tagged or ask your own question.