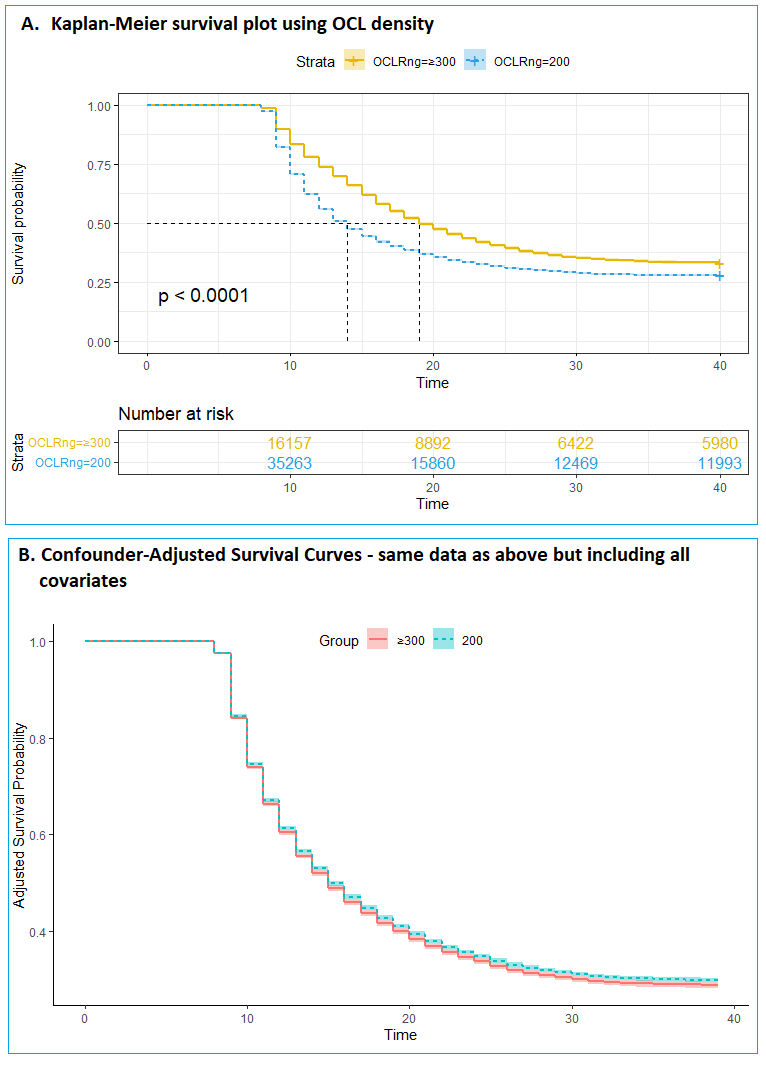
I've begun working with estimating confounder-adjusted survival curves using the adjustedCurves package in R and I need help interpreting results. Image A at the bottom shows a simple Kaplan-Meier survival plot for the data, where I only model the OCL density variable (only 2 states for this variable, values of 200 or 300). I use the survival and survminer packages and my code for fitting and plotting the model is:
fit <- survfit(Surv(mos, status) ~ OCLRng, data = survDF)

ggsurvplot(fit,
           pval = TRUE, conf.int = TRUE,
           risk.table = TRUE, # Add risk table
           risk.table.col = "strata", # Change risk table color by groups
           linetype = "strata", # Change line type by groups
           surv.median.line = "hv", # Specify median survival
           ggtheme = theme_bw(), # Change ggplot2 theme
           palette = c("#E7B800", "#2E9FDF"))
The K-M plot makes intuitive sense in that I expect OCL=300 to have higher survival probability than OCL=200 from experience and from other data stratifications.
Image B at the bottom shows the confounder-adjusted survival curves, using the adjustedCurves package, where I set group = the same OCL variable used above, and introduce other variables of Channels, Node and sRng. My code for fitting and plotting this is:
survDFMod <- survDF %>% mutate(group = as.factor(OCLRng))

outcomeSurvDF <- survival::coxph(Surv(mos, status) ~ Channels + Node + sRng
                                + group, data= survDFMod, x = TRUE)

adjSurvDF <- adjustedsurv(
  data = survDFMod,
  variable = "group",
  ev_time = "mos",
  event = "status",
  method = "direct",
  outcome_model = outcomeSurvDF,
  conf_int = TRUE,
  na.action = "na.omit"
)

plot(adjSurvDF, conf_int=TRUE, linetype=TRUE, legend.position = "top")
Intuitively and in plain language, what is the confounder-adjusted survival curve in Image B below telling me? And why conceptually could it be that the relationship has reversed from what is shown in the Image A K-M survival curve, where the OCL = 300 appears to have a lower survival probability than OCL = 200?
Edit to include insights from Denzo and EdM responses:
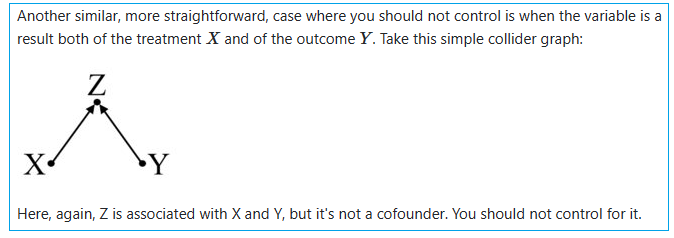
From reviewing the materials referred by Denzo and from EdM's comments, and in particular the discussion on confounders in Confounder - definition, I believe my OCL variable falls into the following category (where the Z variable illustrated below is similar to my OCL variable):


