4
$\begingroup$

I have been asked whether there is any relationship between two variables $X$ and $Y$. I have done a simple regression and the confidence intervals suggest a small significant relationship. However, these variables are nonnegative and most of the points are "close" to (0,0) --- in the sense that in a graph of the points partitioned into a grid pattern most of the points will be within the square with the "south west" corner at (0,0).

Does this violate the assumptions of regression? I believe "yes" because the errors in the regression might not be normally distributed (they would be bounded for a given $x\in X$).

How can I best answer the question about the relationship between $X$ and $Y$? Should I just use simple regression or are there ways to get around this possible violation?

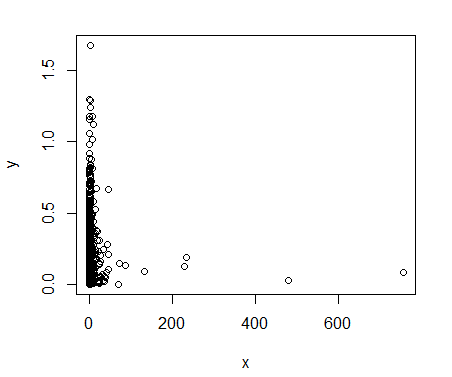
My data looks a bit like

 set.seed(5)
 x <- abs(rcauchy(1000,0,1))
 set.seed(5)
 y <- rexp(1000,5)
 plot(x,y)

though there is no reason to believe that the underlying distributions of either are cauchy or exponential.

$\endgroup$
0

1 Answer 1

4
$\begingroup$

It's common (one might even suggest a stronger term) in this situation for the spread to increase with the mean.

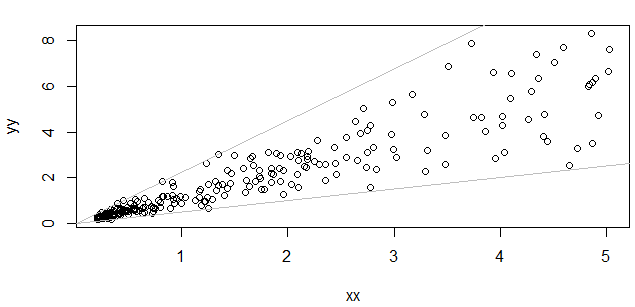
That is, if what you're trying to describe looks like this:

scatterplot of skewed variables with increasing spread

so that xx and yy here are heavily skew, and display a standard deviation proportional to the mean, and it even looks like the points are restricted in a narrow range bounded by straight lines (marked in grey).

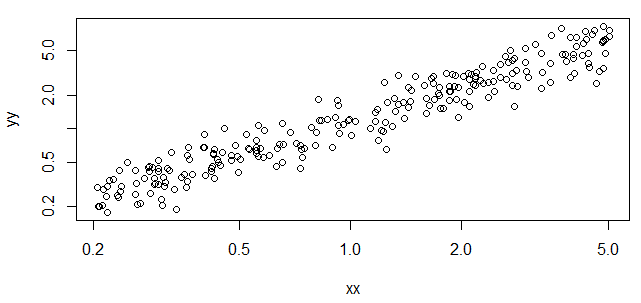
In that situation, what you may want to do is take logs of both sides:

now after taking logs

What does your data look like?


Edit: On your simulated data, your plot looks like

OP's sample plot

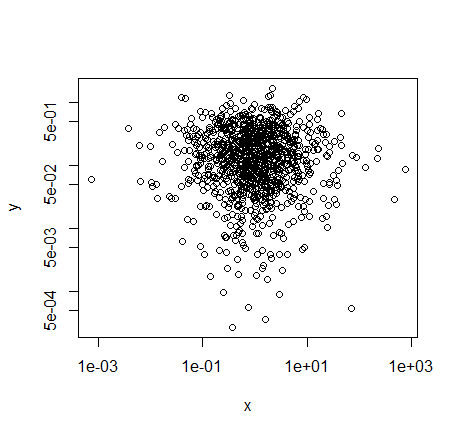
If you take log scales for both variables, it's much easier to see the relationship:

plot(x,y,log="xy")

plot on log scale

$\endgroup$
4
  • $\begingroup$ Added code for what my data looks like. $\endgroup$
    – Hugh
    Commented Jun 7, 2013 at 4:42
  • $\begingroup$ By "constrained", I only mean that X and Y >= 0 (strictly and theoretically). They can (and might) obtain any nonnegative real value but can never be negative. I'm interested in the case you describe too, but it doesn't reflect my particular problem. $\endgroup$
    – Hugh
    Commented Jun 7, 2013 at 4:45
  • $\begingroup$ Hugh, see my updated answer. Even if you don't model it on that scale, it helps to understand it. $\endgroup$
    – Glen_b
    Commented Jun 7, 2013 at 4:47
  • $\begingroup$ Even though it doesn't directly address your now clarified question I'm going to leave the original response as well as the new one, since both parts of my answer really relate to situations where log scales on the plot make it easier to understand what's going on. $\endgroup$
    – Glen_b
    Commented Jun 7, 2013 at 7:05

Your Answer

By clicking “Post Your Answer”, you agree to our terms of service and acknowledge you have read our privacy policy.

Not the answer you're looking for? Browse other questions tagged or ask your own question.