5
$\begingroup$

My bioinformatical problem looks like this:
two sets of gene sequences (size of set A > 1000, size of set B > 1000; sequence length varies from 1000 to 100000).

Set_A_Sequence_1: ACGTACGTACGT...
Set_A_Sequence_2: ACGGAAGT AAA T...
....
Set_B_Sequence_1: AAA G AAA TG AAA ...
Set_B_Sequence_2: AAA TC AAA C AAA ...
...

I want to see if Set_B sequences are enriched for specific word (for example: AAA).
How can I do this?
I came up with three solutions:

  1. Count how many Set_A sequences have/don't have word;
    Count how many Set_B sequences have/don't have word.
    Apply Fisher's test.
  2. Count how many word occurrences there are per sequence in Set_A;
    Count how many word occurrences there are per sequence in Set_B.
    (For a given set example that would be: Set_A:0,1; Set_B:3,3).
    What statistical test I can use for such enrichment analysis?
  3. Calculate percentage of sequence in Set_A covered with word;
    Calculate percentage of sequence in Set_B covered with word.
    (For example, data would look like this: Set_A:0%,25%; Set_B:75%,75%).
    What statistical test I can use for such enrichment analysis?

Questions:
Is it right to use Fisher test in solution 1 (Contain/Don't contain word)?
What statistical tests I could use for solution 2 (Number of words)?
What statistical tests I could use for solution 3 (Coverage with word)?

Edit
Simplified data looks like this:

Sequence name   Length   Contain word(0/1)   Number of words   Coverage with word(%)  

Set_A_seq_1     1000               0                0                 0
Set_A_seq_2     2000               1                1                 15
Set_A_seq_3     3450               0                0                 0
Set_A_seq_4     10000              0                0                 0
Set_A_seq_5     25000              1                2                 5
...

Set_B_seq_1     20000              1                3                 25  
Set_B_seq_2     100000             1                3                 30
Set_B_seq_2     9000               1                5                 70
Set_B_seq_2     10000              1                10                85
Set_B_seq_2     12000              1                7                 60
...          

EDIT

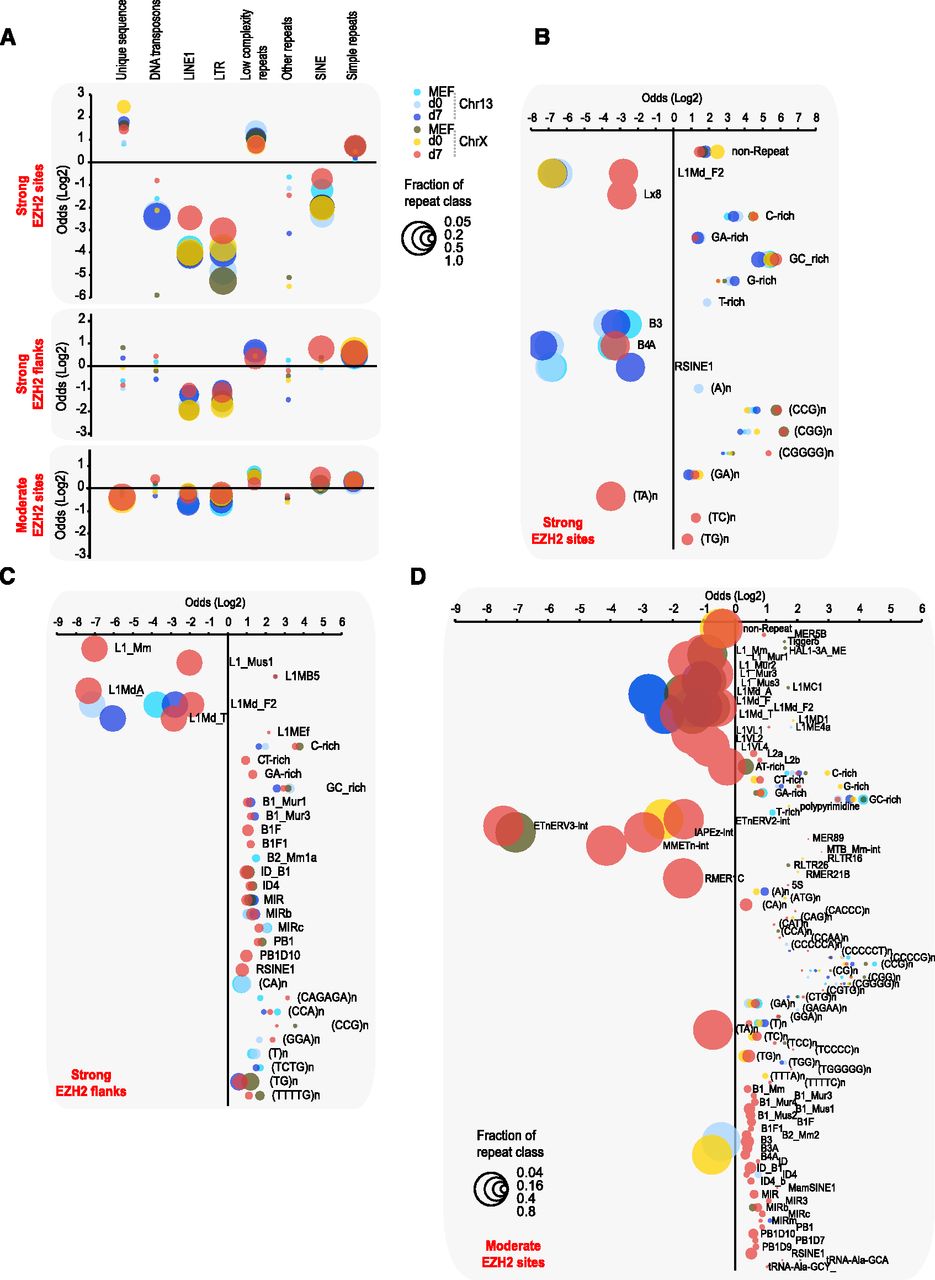
I wasn't able to find a lot of published methodology for genomic site enrichment, but this figure suggests perfect way of solving problem that I have. Figure A. - Enrichment in three different genomic sites compared using permutation and odd enrichment to permutated data. Relationship of repetitive elements to specific genomic sites (22948768)
$\endgroup$
1
  • 1
    $\begingroup$ The figure is interesting. Could you give the reference where you took it from? $\endgroup$
    – gui11aume
    Commented Jun 24, 2013 at 0:02

2 Answers 2

4
+100
$\begingroup$

Solution 1 has an issue with sequence length. For instance, if you are interested in the word A and all your sequences have length 10,000 it is extremely likely that they all contain the word of interest in which case the Fisher test will not report anything significant, even if the occurrence of the word varies a lot within the sequences.

Solution 2 suffers some bias if the sequences from the set A do not have the same average length as the sequences of set B.

Solution 3 looks best to me. But you should concatenate all the sequences of set A, compute the average coverage by the word of interest and do the same with the sequences of set B, so that you are down to the problem of comparing two proportions.

To my knowledge, giving the correct answer to your problem is currently impossible because the occurrences of the words are not independent. If these are real genes there can be strong local dependencies between the words, and modeling those dependencies is technically challenging.

However, if you are ready to accept the simplifying assumption that words are independent and identically distributed, you can use the Gaussian approximation and wrap it up with Student's t-test. You can find a full account of this approach on this page.

Briefly, you compute the two proportions $p_1$ and $p_2$, use the pooled standard error estimate $\sqrt{p_1(1-p_1)/n_1 + p_2(1-p_2)/n_2}$, where $n_1$ and $n_2$ are the total nucleotide lengths of sequences in set A and B and look up the value of the following statistic in the quantiles of the standard Gaussian distribution.

$$ x = \frac{p_1-p_2}{\sqrt{p_1(1-p_1)/n_1 + p_2(1-p_2)/n_2}} $$

If you use R, the p-value of the test will be 2*pnorm(abs(x), lower.tail=FALSE).

$\endgroup$
8
  • $\begingroup$ Thank you for the answer! I got the point and it's a little bit more clear now, but I still have few questions: 1) r-bloggers.com/two-sample-students-t-test-1 says that t-test should be used for normal distribution data and is #3 solution (percentage of coverage) distributed normally? Shouldn't I use wilcox for such data? 2) Do I have to do normality test as mentioned in the link above? 3) Let's assume that I did permutations and have datasets that contain equal size items (no length bias). How could I test such equally sized datasets difference with #1 & #2 solutions? $\endgroup$
    – pogibas
    Commented Jun 12, 2013 at 22:31
  • $\begingroup$ I was suggested to do permutations and it seems to be a reasonable solution. Just shuffle coordinates genome wide, calculate hits in simulated set , repeat *1000, calculate empirical p value and then I should be able to compare such enrichment between my original datasets. (I added figure just to for example how I would like my data to look like). $\endgroup$
    – pogibas
    Commented Jun 12, 2013 at 22:45
  • $\begingroup$ @Poe Regarding your concern about normality, the justification for the approach is the Central Limit Theorem. The score above is a mean computed with large $n$, so its distribution is asymptotically Gaussian. I don't see how you could do a Wilcoxon test in these conditions because you have only two numbers. $\endgroup$
    – gui11aume
    Commented Jun 13, 2013 at 9:12
  • $\begingroup$ @Poe Permutation is a very good option. You have to think about the way you are going to permute the data and there are several options, which test different null hypotheses. You can shuffle the coordinates, but I guess you scores are going to be identical. You can Randomly pick with replacement sequences from set A and set B to form set C and set D, and compare set C and D 1000 times. You can also regenerate the sequences of set A and B with the same Markov model (the will have the transitions between k-nucleotides) and recompute the occurrence of the motifs 1000 times. $\endgroup$
    – gui11aume
    Commented Jun 13, 2013 at 9:16
  • $\begingroup$ "you have only two numbers" - is there a difference if I compute average coverage for all Set_A and Set_B or use coverage for every sequence independently? r-bloggers example use non-averaged input (input for t-test is a string). $\endgroup$
    – pogibas
    Commented Jun 13, 2013 at 9:18
2
$\begingroup$

This question reminded me of the FASTQC output....that is the result of scanning many short sequences (reads)....and looking for overrepresented motifs

From : http://www.bioinformatics.babraham.ac.uk/projects/fastqc/Help/3%20Analysis%20Modules/11%20Overrepresented%20Kmers.html

This module counts the enrichment of every 5-mer within the sequence library. It calculates an expected level at which this k-mer should have been seen based on the base content of the library as a whole and then uses the actual count to calculate an observed/expected ratio for that k-mer.

$\endgroup$

Your Answer

By clicking “Post Your Answer”, you agree to our terms of service and acknowledge you have read our privacy policy.

Not the answer you're looking for? Browse other questions tagged or ask your own question.