4
$\begingroup$

Suppose we have 2 reports. These reports' original values are either all 0 or all a (a>0). Let $x_i$ be independent Laplace(0, b) random variables. For each report, we generate a random noise $x_i$ and add it to the report’s original value. Then we add the value of 2 reports, resulting in a sum $s_0 = x_i + x_j$ or $s_1 = x_k + x_l +2a$

The question is: Suppose we want to be 95% certain that the original value is not 0, what should be the minimum value of a?

Side note: We may have more than 2 reports. In a more general case, the question can be formulated as follows: Suppose we have n reports. The original value on these reports are either all 0 or all a (a > 0). Let $x_i$ be independent Laplace(0, b) random variables. For each report, we generate a random noise $x_i$ and add it to the report’s original value. Then we add the value of n reports, resulting in a sum $s_0 = \Sigma_{i=1}^n x_i$ or $s_1 = \Sigma_{i=1}^n x_i + a*n$.

The question is: Suppose we want to be 95% certain that the original value is a, what’s the minimum value of n?

$\endgroup$

2 Answers 2

8
$\begingroup$

Upon dividing everything by $b,$ the question concerns working with the sum of $n$ independent Laplace distributions. (A Laplace distribution arises as the difference of two independent Exponential distributions.)

The density of this sum can be found by applying the inverse Fourier Transform to its characteristic function. When $X$ has an exponential distribution, by definition its characteristic function (c.f.) is

$$\phi_X(t) = E\left[e^{itX}\right] = \int_0^\infty e^{itx}e^{-x}\,\mathrm dx = \frac{1}{1 - it}.$$

Therefore the c.f. of the Laplace distribution is

$$\phi(t) = \phi_X(t) + \phi_{-X}(t) = \frac{1}{1-it} + \frac{1}{1 + it} = \frac{1}{1 + t^2}.$$

Consequently, the c.f. of the sum of $n$ iid Laplace variates is

$$\hat f_n(t) = \phi(t)^n = \frac{1}{(1+t^2)^n}.$$

Its inverse Fourier transform, normalized to integrate to unity, can be found in terms of the Bessel K function as

$$f_n(x) = \frac{|x|^{n-1/2} K_{n-1/2}(|x|)}{\sqrt{2\pi} 2^{n-1}\Gamma(n)}.$$

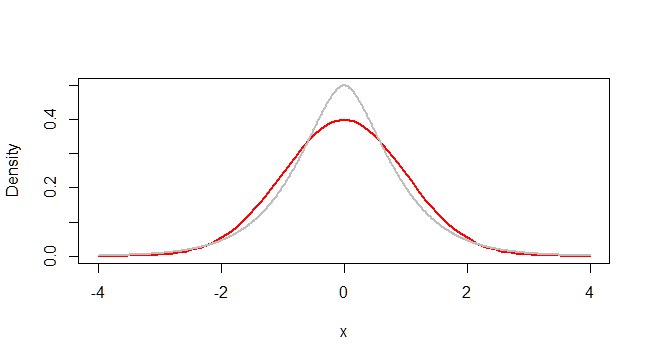
Its CDF can be expressed in terms of generalized hypergeometric functions. Because implementations of those in statistical software are uncommon, you can resort to numerical integration. It will work well because the Central Limit Theorem asserts $f_n,$ standardized to unit variance, will be close to a standard Normal distribution for large $n$ and numerical integration of that is straightforward. In fact, $n\ge 2$ already works decently: it's the gray density in this plot (the red density is the standard Normal).

enter image description here

Finally, you can find quantiles with a root finder to invert the CDF. But even the Normal approximation for $n=2$ yields the 95th percentile with a relative standardized error of less than $0.01.$

Using this Normal approximation (and bearing in mind that the variance of the Laplace distribution is $1+1=2$), the minimum value of $n$ to test the hypothesis $a=0$ compared to the alternative $a=\mu$ with $1-\alpha$ confidence and $\beta$ power will be close to

$$n_{\min} \approx 2\left(\frac{Z_{1-\alpha} - Z_{1-\beta}}{\mu}\right)^2$$

where the $Z_{*}$ are Standard Normal quantiles. For instance, with $\mu=1/2$ and 95% confidence, 95% power this formula gives $86.58,$ which we round up to $87.$ The test will decide $a=0$ when the observed sum is less than the $0.95$ quantile of the sum of $87$ iid Laplace variables, equal (exactly) to $21.6883;$ and indeed, the sum of $87$ iid Laplace variables each offset by $1/2$ has a $4.90\%$ chance of exceeding this critical value. That is, the confidence and power are very close to the intended ones for this value of $n.$


The following R code computes the log density f, the cumulative probability function pf, and the quantile function qf using the straightforward numerical methods described above. The calculation of f for arguments near $0$ is fraught because the formula is a division of infinity by infinity; for small arguments it therefore uses an asymptotic approximation for $K_{n-1/2}.$ These functions still only work for $n$ between $1$ and c. $100,$ because above those values the Bessel function tends to overflow even for largish arguments. But for larger $n$ the Normal approximation is excellent.

f <- function(x, n, eps = 1e-3) {
  x <- abs(x)
  lb <- ifelse(x <= eps, (n - 3/2) * log(2) - (n - 1/2) * log(x) + lgamma(n - 1/2),
               log(besselK(x, n - 1/2, expon.scaled = TRUE)) - x)
  (1 - n) * log(2) + (n - 1/2) * log(x) + lb - lgamma(n) - log(2 * pi) / 2
}
pf <- Vectorize(function(x, n, eps = 1e-3, ...) {
  s <- sign(x)
  x <- -abs(x)
  v <- integrate(\(x) exp(f(x, n, eps)), -8 * sqrt(2 * n), x, ...)$value
  ifelse(s >= 0, 1 - v, v)
}, "x")
qf <- function(q, n, ...) {
  x0 <- sqrt(n) * min(log(q/2), log((1-q)/2))
  uniroot(\(x) pf(x, n, ...) - q, c(x0, -x0))$root
}
$\endgroup$
5
  • $\begingroup$ Thanks for your detailed answer!! The logic seems reasonable to me but I wonder what's the reason to compute log density f instead of the original density in the R code? $\endgroup$
    – Elena
    Commented May 17, 2023 at 22:38
  • $\begingroup$ Also, would you mind providing the r code for the density plot? Mine looks different when I tried to plot the $f_n$ function with $n = 2$. $\endgroup$
    – Elena
    Commented May 17, 2023 at 23:08
  • 1
    $\begingroup$ For computational reasons: the numbers involved in the calculation can be really large or really small and using the logarithms avoids overflow and underflow. The plot was produced by curve(dnorm(x), -4, 4, ylim = c(0, .5), lwd = 2, col = "red", ylab = "Density"); for (n in c(2)) curve(exp(f(x*sqrt(2*n), n)) * sqrt(2*n), add = TRUE, lwd = 2, n = 601, col = "Gray") Notice the change of scale to $\sqrt{2n}$ (here, $n=2$) to standardize the density. $\endgroup$
    – whuber
    Commented May 17, 2023 at 23:09
  • $\begingroup$ Yes, I miss the standardizing part. Can you explain a little more why we can standardize it by multiplying x with $\sqrt{2n}$ in the function and multiplying it again outside of the function? $\endgroup$
    – Elena
    Commented May 18, 2023 at 18:36
  • 1
    $\begingroup$ stats.stackexchange.com/questions/14483, stats.stackexchange.com/questions/223317, etc. $\endgroup$
    – whuber
    Commented May 18, 2023 at 19:29
3
$\begingroup$

If $x_i\sim\text{Laplace(0, b)}$ and

$$y=\sum_{i=1}^nx_i$$

then $y$ is a mixture of double (two-sided) gamma distributions:

$$f(y)=\sum_{i=1}^nw_i\frac{b^i|y|^{i-1}}{2\Gamma(i)}e^{-b|y|}$$

with

$$w_{i\in2...n}(n)=\binom{2n-i-1}{n-i}2^{i-2n+1}$$

and $w_1=w_2$.

I'm not up for showing the derivation, but it could be done by partial fraction expansion of the characteristic function of the sum of $n$ iid Laplace random variates.

A quick check in R:

set.seed(1044174532)

fcoeff <- function(n) {
  # function to get coefficients of a gamma mixture with the same distribution
  # as the sum of n Laplace(0, 1) random variates
  C <- numeric(n)
  k <- (2*n - 3):(n - 1)
  # C[2:n] <- choose(k, (n - 2):0)/2^k
  C[2:n] <- exp(lgamma(k + 1) - lgamma((n - 1):1) - lgamma(n) - k*log(2))
  C[1] <- C[2]
  C
}

n <- 5L # number of Laplace r.v. to sum
s <- 1e5L # number of samples
# sum of iid Laplace(0, 1) r.v. as a gamma mixture
x <- rgamma(s, sample(n, s, 1, fcoeff(n)))*sample(c(-1, 1), s, 1)
# sum of iid Laplace(0, 1) r.v. directly
y <- rowSums(matrix(rexp(s*n)*sample(c(-1, 1), s*n, 1), s, n))
ks.test(x, y)
#> 
#>  Asymptotic two-sample Kolmogorov-Smirnov test
#> 
#> data:  x and y
#> D = 0.00194, p-value = 0.9918
#> alternative hypothesis: two-sided
plot(ecdf(x), col = "blue")
plot(ecdf(y), col = "orange", add = TRUE)
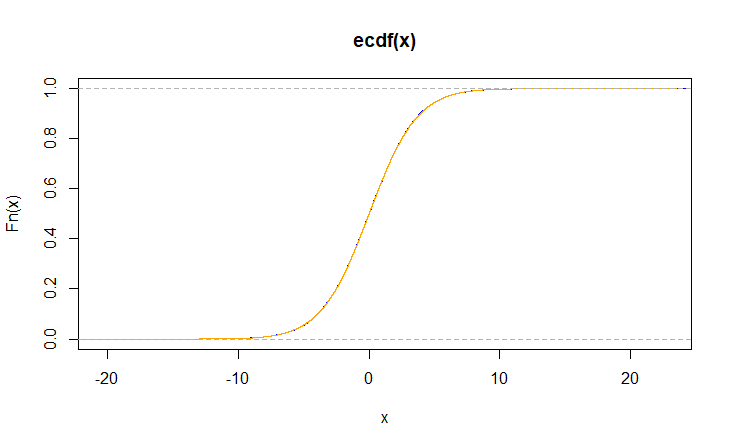
enter image description here

From this, get the CDF and quantile functions for the distribution of $y$:

pnlaplace <- function(q, b, n) {
  0.5 + sign(q)*sum(pgamma(abs(q), 1:n, b)*fcoeff(n))/2
}

qnlaplace <- function(p, b, n) {
  if (p < 0.5) {
    uniroot(\(a) pnlaplace(a, b, n) - p, c(n*log((1 - p)/2), 0))$root
  } else {
    uniroot(\(a) pnlaplace(a, b, n) - p, c(0, -n*log((1 - p)/2)))$root
  }
}

To determine the minimum value of $a$ for $n=2$ (two reports), first specify $b$ and the desired confidence and power for the hypothesis test:

b <- 1
n <- 2L
alpha <- 0.05 # type I error
beta <- 0.1 # type II error

Next, find $x_0$ (the value of $s_0$ that will give the desired confidence level) and $x_1$ (the value of $s_1 - x_0$ that will give the desired power). $a$ is the average of $x_0$ and $x_1$:

# value of s0 to reject null hypothesis with 1 - alpha confidence
(x0 <- qnlaplace(1 - alpha, b, n))
#> [1] 3.27181
# value of s1 - x0 needed for a test with 1 - beta power
(x1 <- qnlaplace(1 - beta, b, n))
#> [1] 2.397277
(a <- (x0 + x1)/n)
#> [1] 2.834543

Check the type I and type II errors with a simulation:

mean(rowSums(matrix(rexp(1e6*n)*sample(c(-1, 1), 1e6*n, 1), 1e6, n)) > x0)
#> [1] 0.050136
mean(rowSums(matrix(rexp(1e6*n)*sample(c(-1, 1), 1e6*n, 1), 1e6, n)) + n*a < x0)
#> [1] 0.100319

Similarly determine the minimum value of $n$ to achieve the desired confidence and power given $a$:

a <- 1
# find the lowest value of n that satisfies the specified errors (alpha, beta)
# first find the lower and upper bound on n to pass to the solver
n <- 2L
while (1 - pnlaplace(qnlaplace(1 - alpha, b, n) - a*n, b, n) < 1 - beta) n <- n*2L
(n <- ssanv::uniroot.integer(\(n) pnlaplace(qnlaplace(1 - alpha, b, n) - a*n, b, n) - beta, c(n/2L, n), step.power = log2(n) - 2)$root)
#> [1] 17

Again, check the errors with a quick simulation:

# value of s0 to reject null hypothesis with 1 - alpha confidence
(x0 <- qnlaplace(1 - alpha, b, n))
#> [1] 9.574182
mean(rowSums(matrix(rexp(1e6*n)*sample(c(-1, 1), 1e6*n, 1), 1e6, n)) > x0)
#> [1] 0.050118
mean(rowSums(matrix(rexp(1e6*n)*sample(c(-1, 1), 1e6*n, 1), 1e6, n)) + n*a < x0)
#> [1] 0.099337

These functions are capable of working with large $n$, but because of the use of nested solvers, the process of finding the minimum $n$ becomes noticeably slower as $n$ gets large:

a <- 0.01
system.time({
  n <- 2L
  while (1 - pnlaplace(qnlaplace(1 - alpha, b, n) - a*n, b, n) < 1 - beta) n <- n*2L
  n <- ssanv::uniroot.integer(\(n) pnlaplace(qnlaplace(1 - alpha, b, n) - a*n, b, n) - beta, c(n/2L, n), step.power = log2(n) - 2)$root
})
#>    user  system elapsed 
#>   32.29    0.47   32.80

n
#> [1] 171277
$\endgroup$
3
  • $\begingroup$ Thanks for your detailed answer!! I know you said you are not up to showing the derivation, but I am having a hard time getting the gamma mixture distribution representation. Would you mind showing some key steps? It would be very helpful. $\endgroup$
    – Elena
    Commented May 18, 2023 at 16:25
  • 1
    $\begingroup$ See stats.stackexchange.com/a/72486/919 for details. $\endgroup$
    – whuber
    Commented May 18, 2023 at 19:30
  • 1
    $\begingroup$ @Elena Use the binomial theorem to expand $$\Bigg(\frac{1}{1+it}+\frac{1}{1-it}\Bigg)^n$$Then use the residue method to decompose $(1+it)^{-a}(1-it)^{-b}$. It might be a good question for math.stackexchange.com. Someone there may have a more clever approach. $\endgroup$
    – jblood94
    Commented May 18, 2023 at 22:14

Your Answer

By clicking “Post Your Answer”, you agree to our terms of service and acknowledge you have read our privacy policy.

Not the answer you're looking for? Browse other questions tagged or ask your own question.