You are seeing the difference between statistical significance and practical significance.
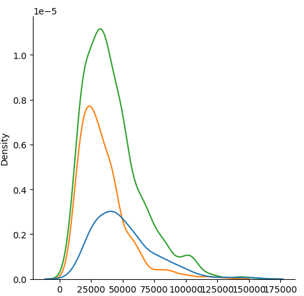
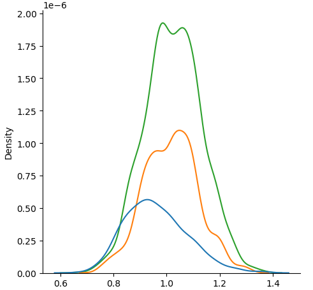
I am with you that the distributions are different. They sure seem have different means. However, the distributions are not all that different. It should be hard to consistently classify the group. You might be able to do such classification occasionally and achieve an okay accuracy, but a high accuracy based on these two features seems impossible.
If you have this kind of overlap on the rest of your features, then you should not expect to score high accuracy values if you just use those features. While the distributions are statistically significantly different, the practical significance is not so great to result in high classification accuracy.
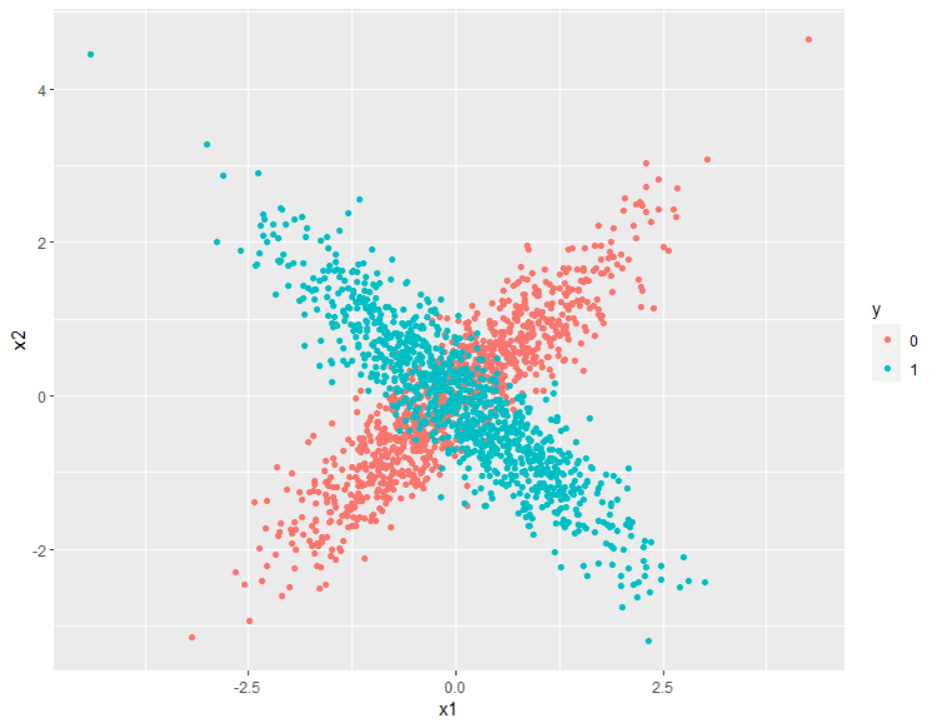
Where you might be able to make some progress is by considering multivariate distributions through interaction terms between the original features. For instance, consider the example below.
library(ggplot2)
library(MASS)
library(pROC)
set.seed(2023)
N <- 1000
X0 <- MASS::mvrnorm(
  N,
  c(0, 0),
  matrix(c(
    1, 0.9,
    0.9, 1
    ), 2, 2)
)
X1 <- MASS::mvrnorm(
  N,
  c(0, 0),
  matrix(c(
    1, -0.9,
    -0.9, 1
  ), 2, 2)
)
X <- rbind(X0, X1)
y <- c(
  rep(0, N), rep(1, N)
)
d <- data.frame(
  x1 = X[, 1],
  x2 = X[, 2],
  y = as.factor(y)
)
ggplot(d, aes(x = x1, y = x2, col = y)) +
  geom_point()
L1 <- glm(y ~ X[, 1] + X[, 2], family = binomial)
L2 <- glm(y ~ X[, 1] + X[, 2] + X[, 1]:X[, 2], family = binomial)
r1 <- pROC::roc(y, predict(L1))$auc
r2 <- pROC::roc(y, predict(L2))$auc
print(r1) # I get 0.5248, so barely above chance
print(r2) # I get 0.9577, which is quite strong performance

In this example, the marginal distributions of the features are identical for the two categories (y), so predictions based on just the raw features cannot be accurate. However, looking at the plot, the joint distribution of the features are clearly different for the two categories. Considering the interaction leads to much stronger performance. A number of machine learning models consider these kinds of interactions internally without you having to explicitly program them, among them being random forests and neural networks.
A useful visualization for you might be something like a t-SNE plot. While t-SNE can fail to separate categories when they truly are separable and introduce separability when the categories are not, such a plot is suggestive of whether or not even considering interactions and joint distributions of the features will allow for accurate classifications by any model. It might be that, even if the (even marginal) distributions of the features are different, the categories simply are not that separable on the given features, and strong performance using these features is impossible.
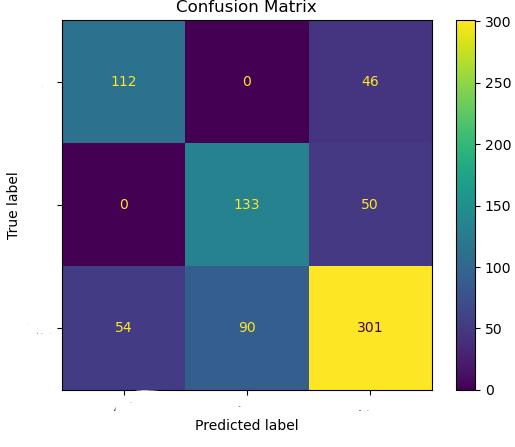
Note the issues with accuracy as a performance metric, especially in a situation with imbalanced classes like you appear to have.


