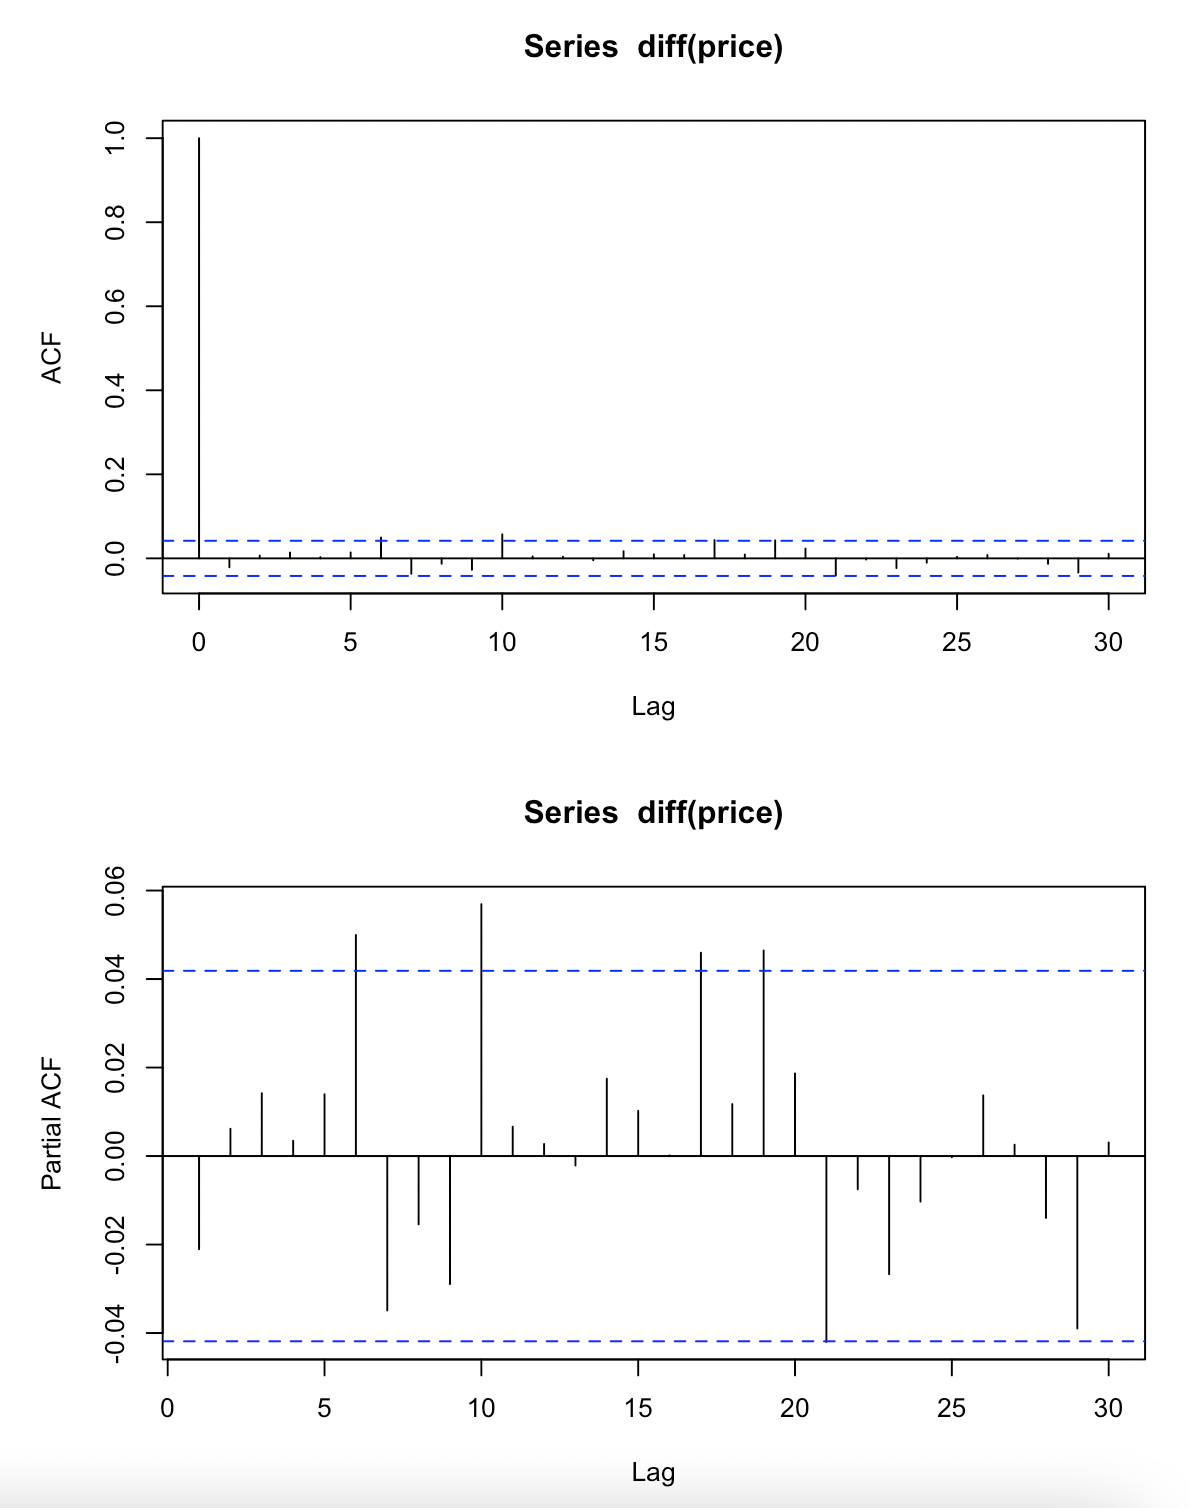
I have just started learning fitting arima model for time series. So I am not very sure what AR and MA order I should use. May I know what are some possible arima models for the following ACF and PACF plot?
1 Answer
From interpreting both the ACF and PACF plots, along with the assumption that you have obtained the first-difference of the time series as indicated by diff(price) - the indication is that the best fit ARIMA model for the above is ARIMA(0,0,0) with zero mean.
Note that this type of time series is simply white noise or randomness - so the errors of the time series are uncorrelated and there is no predictive power in the forecast.
If you are attempting to use an ARIMA model to predict stock price - which appears to be what you are attempting to do in the above scenario - then this is not likely to work well.
These types of time series tend to be highly stochastic (or random) in nature.
For instance, weather patterns show strong seasonality trends (warm in summer, cold in winter). An airline company could see higher than average ticket sales during the high season for travel, whereas the winter months would see a seasonal lull.
Stock prices are influenced by a plethora of random events and do not exhibit such predictable seasonality. Thus, using past data to predict future prices is not feasible - as new factors that would currently be influencing price are not reflected in past data.
You might also find the following answer of use: How to interpret Arima(0,0,0)
-
$\begingroup$ Thanks a lot for the detailed answer! $\endgroup$– lucyCommented Jun 13, 2023 at 9:53

