12
$\begingroup$

I am trying to understand the validity of bootstrap percentile confidence intervals and I have stumbled on the following from these slides:

Suppose we want to set a 95% confidence interval on $θ$, the true parameter value for the real population $f$ . And suppose we take $M = 1000$ bootstrap samples. The bootstrap method suggests that approximately 95% of the time, the true parameter value for $\hat{f}_n$ falls between the 2.5th percentile of the bootstrap samples and the 97.5th percentile. (Recall percentile definitions in Lecture 2.)

Since $\hat{f}_n$ converges to $f$ , the correct confidence interval for the true parameter for $\hat{f}_n$ should converge to the correct confidence interval on the true parameter for $f$ .

Since in boostrapping we assume that our (original) sample is a good approximation for the population, sampling with replacement from this samples allows us to approximate the theoretical sampling distribution. Nevertheless, for the bold statement to be true it must be the case that the 0.025th and 97.5th percentiles of the theoretical sampling distribution contain the true population parameter. Is this always true? It holds for sample mean but what about other statistics?

EDIT

I am adding the following figure to better express my confusion. The following section is only about the theoretical sampling distribution. enter image description here
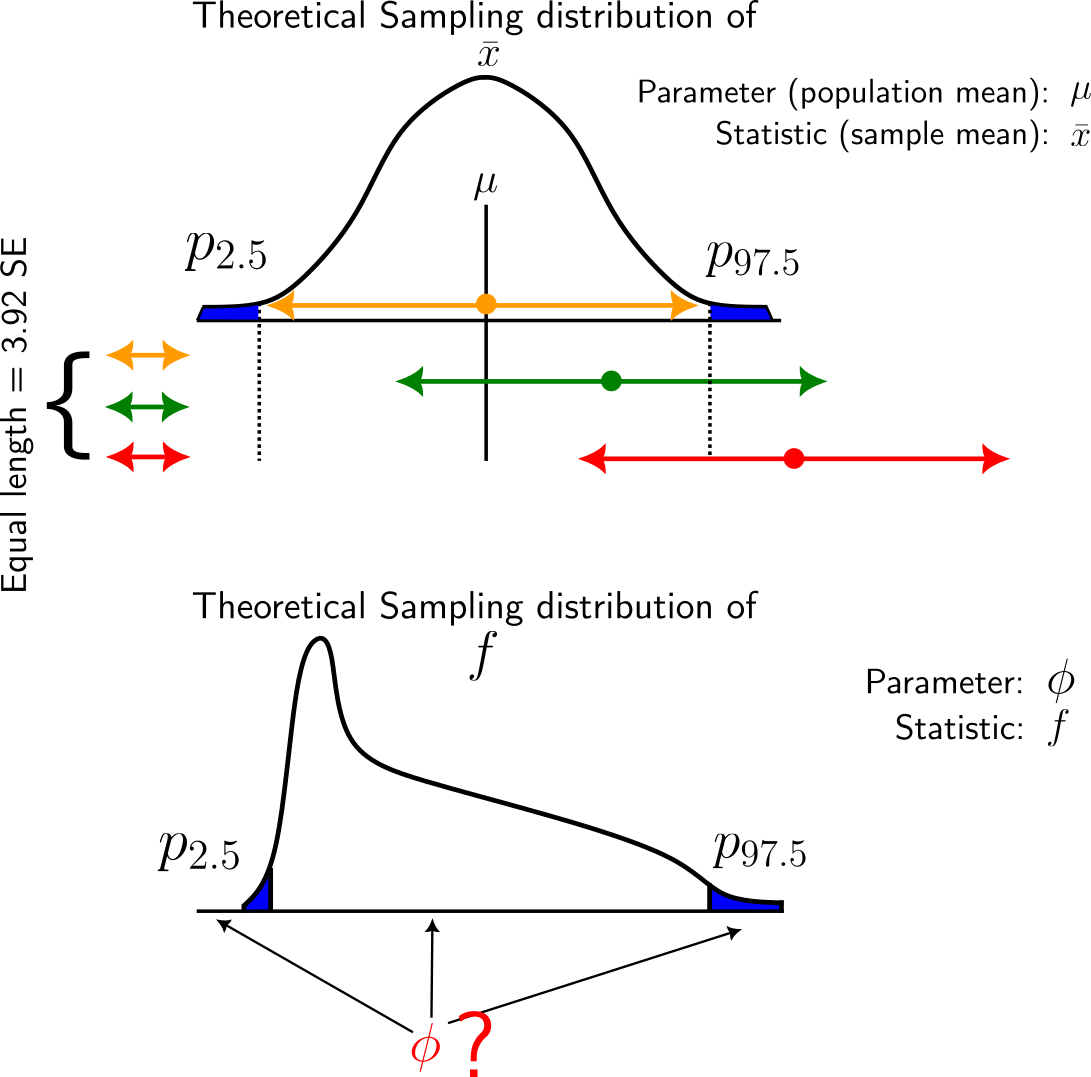
Theoretical sampling distribution

In top is the sampling distribution of the sample mean. In this case, the population mean $\mu \in [p_{2.5}, p_{97.5}]$, where $p_{2.5}$ and $p_{97.5}$ are the 2.5th and the 97.5th percentiles, respectively.

In bottom, is the sampling distribution of a statistic called $f$ (nothing specific, an arbitrary statistic).

  • Is it necessary that the true population parameter $\phi \in [p_{2.5}, p_{97.5}]$? Could $\phi$ lie outside this interval, either left from $p_{2.5}$ or to the right of $p_{97.5}$?

Confidence intervals (CI)

Suppose we want to construct the 95% CI for the population mean. Well, we can sample from our population a sample $S = \{x_1, x_2, \ldots, x_n\}$ calculate the sample mean $\bar{x}$ and report the 95% CI as:

$$ \bar{x} \pm 1.96 \cdot \text{SE} \tag{1} $$

where SE is standard error (the standard deviation of the sampling distribution).

Of course, we don't have access to the standard deviation of the sampling distribution and as such we can approximate it with the standard deviation of the sample $s$ (wheter this is a good approximation or not is another story). Assuming that this approximation is valid, then the 95% CI:

$$ \bar{x} \pm 1.96\cdot s \tag{2} $$

If we repeat the same procedure ad infinitum, i.e. collect a sample, calculate its mean and standard deviation, and report the interval based on Equation 2 then, 95% of the times these intervals will contain the true population mean. For example, the interval constructed from the green sample contains the true population mean while the red doesn't.

Alternatively, we could also report as 95% CI the interval $[p_{2.5}, p_{97.5}]$. As said before, we don't have access to the sampling distribution, and as such we can approximate this interval with the percentile values from our sample.

  • Since we can report a confidence interval by just using our sample, why bootstrapping the sample at all? Is that because bootstrapping a sample gives a better approximation to the sampling distribution (assuming the sample is representative of the population)?

  • With regards to the bold statement: I understand that a 95% CI doesn't necessarily contain the true parameter. The 95 percent of them contain it while the other 5 percent don't. My confusion is the following: if the population parameter of interest can be outside $[p_{2.5}, p_{97.5}]$ of the sampling distribution (see bottom figure), how confidence intervals based on percentiles are valid at all?

$\endgroup$
9
  • 3
    $\begingroup$ I have the same concern with the bootstrap percentile interval being sold as "confidence interval" (+100 if I could) $\endgroup$
    – Ute
    Commented Jul 29, 2023 at 14:23
  • 1
    $\begingroup$ It seems to me that most answes jump sraight away to "confidence intervals" - maybe you could put emphasis on "theoretical" in your question "the 0.025th and 97.5th percentiles of the theoretical sampling distribution contain the true population parameter." $\endgroup$
    – Ute
    Commented Jul 29, 2023 at 14:27
  • $\begingroup$ @Ute I will add an edit asap. $\endgroup$ Commented Jul 29, 2023 at 15:39
  • $\begingroup$ The title of the question and the content are inconsistent. Does the guarantee apply to all bootstrap-produced CIs for a statistic, or to all possible statistics (eg mean, median, etc) of interest? The title could be rephrased to "Do the 2.5th and 97.5th percentile of the theoretical sampling distribution of a statistic always contain the true population parameter 95% of the time?" $\endgroup$ Commented Jul 29, 2023 at 23:20
  • $\begingroup$ @BetterthanKwora : I don't think this was intended. The 2.5th and 97.5th percentile of the theoretical sampling distribution are fixed numbers. It does not make sense to require that the true parameter is included in 95% of the time, but I can understand that the discussion in the answers makes the impression to address exactly this point. I believe this is a shortcut between the bold statement (from the slides) and the final question "is this always true?" $\endgroup$
    – Ute
    Commented Jul 29, 2023 at 23:44

3 Answers 3

15
$\begingroup$

You wrote:

Nevertheless, for the bold statement to be true it must be the case that the 0.025th and 97.5th percentiles of the theoretical sampling distribution contain the true population parameter.

No. The bold statement says "95%". And it ought to say "approximately 95%".

Second, as @mkt noted, no CI from a sample can always contain the population parameter. Even if you take the entire range of the sample, it might not. If the sample is random and reasonably sized, then it will be very rare for the sample not to contain the parameter, but ... it might happen.

This is really fundamental to inferential statistics, whether we do it in the "standard" way or via bootstrapping or whatever. The only way to be certain that the CI contains the parameter is to get the CI from some source other than a sample, e.g. by noting what is possible. If we give a CI of 10 kg to 800 kg for the weight of adult humans, then we can be certain.

$\endgroup$
4
  • 2
    $\begingroup$ Good last point and example, but note en.m.wikipedia.org/wiki/Jon_Brower_Minnoch $\endgroup$ Commented Jul 29, 2023 at 11:58
  • $\begingroup$ Dang. I will modify my answer. $\endgroup$
    – Peter Flom
    Commented Jul 29, 2023 at 12:55
  • $\begingroup$ "Second, as @mkt noted, no CI from a sample can always contain the population parameter." A CI either contains the parameter or it doesn't. It doesn't make sense to apply quantifiers such as "always". What you can say is that a process for generating CIs has a 95% chance (given that distribution is properly modeled) of generating a CI that contains the parameter. $\endgroup$ Commented Jul 31, 2023 at 0:39
  • 1
    $\begingroup$ Or en.wikipedia.org/wiki/Lucía_Zárate $\endgroup$
    – Dale M
    Commented Jul 31, 2023 at 1:15
12
+100
$\begingroup$

Bootstrap percentile intervals are not frequentist confidence intervals

This question raises an excellent point against the interpretation of bootstrap percentile intervals in the sense of frequentist confidence intervals. They are not. The issue is not about "only approximating" the confidence level - is just a completely different concept, even if the empirical cumulative distribution would always perfectly fit the true cdf.

Nevertheless, for the bold statement to be true it must be the case that the 0.025th and 97.5th percentiles of the theoretical sampling distribution contain the true population parameter. Is this always true? It holds for sample mean but what about other statistics?

A simple example where the true value never is contained in any central interval of the theoretical sampling distribution is the maximum likelihood estimator for the parameter $\theta$ in the uniform distribution on $[0,\theta]$. This estimator is $\hat\theta = \max(X_1,\dots,X_n)$, which is smaller than the true $\theta$ with probability 1.

... the 0.025th and 97.5th percentiles of the theoretical sampling distribution contain the true population parameter. It holds for sample mean ...

No, it does not even hold for the sample mean. You can, for any sample size $n$, construct a simple counter example: consider an i.i.d sample from a Bernoulli distribution $$X_1,\dots,X_n \stackrel{\text{i.i.d}}\sim\text{Ber}(p)\quad\text{with}\quad p = 1 -.975^{1/n}.$$ Then $$ \mathrm{Prob}(\bar{X} < p) \geq \mathrm{Prob}(\bar{X} = 0) = (1-p)^n = 0.975, $$ thus the estimator $\bar{X}$ is smaller than the true mean $p$ with probability at least 0.975 (equality holds for $n=1$), which means that the 97.5% percentile of the sampling distribution lies below the true parameter.

$\endgroup$
9
  • 2
    $\begingroup$ Another example is the case of asymmetric distributions, where one has to inverse the interval boundaries. Why do the bootstrap calculated p-value and the confidence intervals seem to contradict each other? $\endgroup$ Commented Jul 30, 2023 at 10:16
  • $\begingroup$ Yes, exactly @SextusEmpiricus. I just picked a very simple example. $\endgroup$
    – Ute
    Commented Jul 30, 2023 at 10:33
  • $\begingroup$ @Ute Isn't the sampling distribution of the sample mean normally distributed with mean equal to the population mean? As such, shouldn't the true parameter (population mean) be inside $[p_{0.025}, p_{97.5}]$? $\endgroup$ Commented Jul 30, 2023 at 21:32
  • $\begingroup$ @adosar, no, only if the population is normal distributed. However, if you let sample size increase, the sampling distribution will be approximately normal distributed, if the original distribution has finite mean and variance. This is due to the central limit theorem. In my example, I assumed a given sample size. The larger the sample size, the smaller gets $p = 1 -.975^{1/n}$. $\endgroup$
    – Ute
    Commented Jul 30, 2023 at 22:03
  • 1
    $\begingroup$ @whopper510, thank you, you are completely right, I was thinking at the sum and forgot to divide... $\endgroup$
    – Ute
    Commented Jul 31, 2023 at 1:54
10
$\begingroup$

This can be answered more generally: no method of constructing a confidence interval from a random sample can possibly contain the true population parameter 100% of the time. That is the nature of a sample. When you do not have the whole population, you cannot be certain of the values that you do not have or how they would change your estimate of the population parameter.

$\endgroup$
7
  • 1
    $\begingroup$ Not exactly the same as a confidence interval, but a fiducial interval may possibly contain 100% of the time the true parameter for certain values of the true parameter. An example is here: stats.stackexchange.com/a/592783 $\endgroup$ Commented Jul 29, 2023 at 12:02
  • 1
    $\begingroup$ It is not just the nature of the sample, it is the nature of the confidence interval, that it doesn't contain the parameter 100% of the time. It is supposed to only contain this 95% of the time (or some other specified percentage). An example is a binomial distribution with $p=0$ where the confidence interval will always contain $\hat{p} =0$ (and arguably those intervals are not truly confidence intervals, or at least their nominal coverage rate doesn't agree with their true coverage rate). $\endgroup$ Commented Jul 29, 2023 at 12:05
  • $\begingroup$ @SextusEmpiricus a common cause of confusion is that 95% of the time doesn't mean that there is a .95 probability of the true value being in a particular confidence interval - so we have to be careful (as you were) with the terminology. It is possible to correctly construct a confidence interval that you can be sure does not contain the true value (stats.stackexchange.com/questions/2356/…). $\endgroup$ Commented Jul 30, 2023 at 7:50
  • $\begingroup$ You can also construct a confidence interval where the probability of it containing the true value is not the confidence level (stats.stackexchange.com/questions/26450/…). The important thing to remember is that the 95% relates to a (fictitious) population of confidence intervals, not the particular confidence interval we constructed. We need to be a Bayesian if we want to attach a probability to a particular interval. Both are useful - horses for courses. $\endgroup$ Commented Jul 30, 2023 at 7:52
  • $\begingroup$ @DikranMarsupial I do believe that one can speak in some sense about a probability (or frequency) that an interval contains the true parameter, and one doesn't have to treat it in a Bayesian way for that (I see the difference as whether we condition on the observed statistic or whether we condition on the true value stats.stackexchange.com/a/297237). The problem that I referred to in my last comment is about something different. It is the issue that even for the fictitious population, the nominal coverage frequency is incorrect for many computations of confidence intervals. $\endgroup$ Commented Jul 30, 2023 at 10:09

Your Answer

By clicking “Post Your Answer”, you agree to our terms of service and acknowledge you have read our privacy policy.

Not the answer you're looking for? Browse other questions tagged or ask your own question.