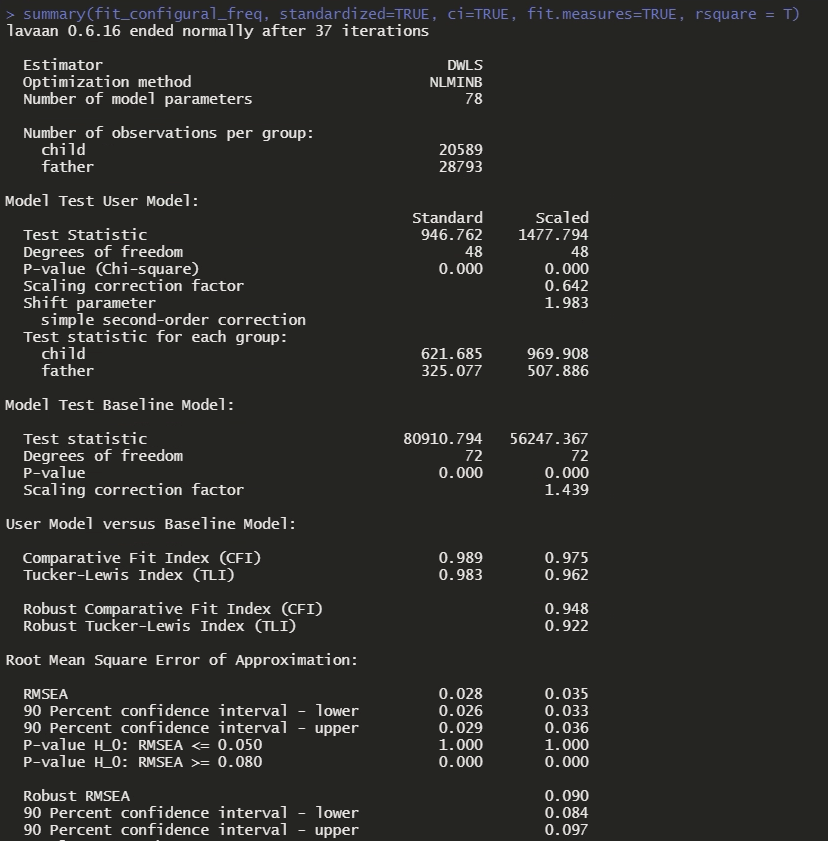
I have run into the same problem repeatedly, namely that model fit increases with increasing model restraints.
I want to compare measurement invariance on a three-factor model (based on previous CFAs for each sub-sample) consisting of nine items with ordinal scores from 1-4 between two groups (adults[N= 29,000] and adolescents[N = 20,500]). The data set I'm using only contains complete cases. This is the method I followed: measEq.syntax: Syntax for measurement equivalence
Lavaan gives me this warning: "some restricted models fit better than less restricted models; either these models are not nested, or the restricted model failed to reach a global optimum"
I also ran a much simpler test where I treated the item values as numeric. Here, the estimates are as expected, with decreasing model fit for each new constraint. I don’t have a good suggestion for why these “numeric” models work.
Maybe the (ordinal) models are non-nested because the group.equal option is overriding some default in the cfa() function, resulting in more parameters being estimated than in the baseline model - even though the number of constraints then brings the degrees of freedom above the baseline model.
I have tried testing different optimization methods and estimators without any results.
My specified model
    mod.cat <- ' sympt1 =~ item1 + item2 + item3 +
             sympt2 =~ item4 + item5 + item6 + item7
             sympt3 =~ item8 + item9'
CONFIGURAL model: no constraints across groups or repeated measures
      syntax.config <- measEq.syntax(configural.model = mod.cat,
                                       data = my_data,
                                       ordered = c("item1", "item2" ...),
                                       parameterization = "theta",
                                       ID.fac = "std.lv",
                                       ID.cat = "Wu.Estabrook.2016",
                                       group = "group")
     mod.config <- as.character(syntax.config)
     fit.config <- cfa(mod.config,
                  data = my_data, group = "group",
                  ordered = c("item1", "item2" ...), parameterization = "theta")
THRESHOLD invariance:
syntax.thresh <- measEq.syntax(configural.model = mod.cat,
                                           data = my_data,
                                           ordered = c("item1", "item2" ...),
                                           parameterization = "theta",
                                           ID.fac = "std.lv",
                                           ID.cat = "Wu.Estabrook.2016",
                                           group = "group",
                                           group.equal = "thresholds")

mod.thresh <- as.character(syntax.thresh)
         fit.thresh <- cfa(mod.thresh,
                   data = my_data, group = "group",
                   ordered = c("item1", "item2" ...), parameterization = "theta")
Reproducible data example
set.seed(123)
responses <- c(1, 2, 3, 4)  # Response categories
n_questions <- 9

#### Response probabilities for children and fathers for each question
prob_children <- c(
  0.735, 0.216, 0.041, 0.009,
  0.735, 0.216, 0.041, 0.009,
  0.735, 0.216, 0.041, 0.009,
  0.735, 0.216, 0.041, 0.009,
  0.735, 0.216, 0.041, 0.009,
  0.735, 0.216, 0.041, 0.009,
  0.735, 0.216, 0.041, 0.009,
  0.735, 0.216, 0.041, 0.009,
  0.735, 0.216, 0.041, 0.009
)

prob_fathers <- c(
  0.9525, 0.0443, 0.0018, 0.0006,
  0.9525, 0.0443, 0.0018, 0.0006,
  0.9525, 0.0443, 0.0018, 0.0006,
  0.9525, 0.0443, 0.0018, 0.0006,
  0.9525, 0.0443, 0.0018, 0.0006,
  0.9525, 0.0443, 0.0018, 0.0006,
  0.9525, 0.0443, 0.0018, 0.0006,
  0.9525, 0.0443, 0.0018, 0.0006,
  0.9525, 0.0443, 0.0018, 0.0006
)

##### Random responses for children and fathers for each question
n_children <- 20500
n_fathers <- 29000

children_data <- lapply(1:n_questions, function(q) {
  sample(responses, n_children, replace = TRUE, prob = prob_children[(q - 1) * 4 + 1:4])
})

fathers_data <- lapply(1:n_questions, function(q) {
  sample(responses, n_fathers, replace = TRUE, prob = prob_fathers[(q - 1) * 4 + 1:4])
})
##### Combining the data into data frames
children_df <- data.frame(Group = rep("Children", n_children), do.call(cbind, children_data))
fathers_df <- data.frame(Group = rep("Fathers", n_fathers), do.call(cbind, fathers_data))

MI_test_data <- rbind(children_df, fathers_df)


