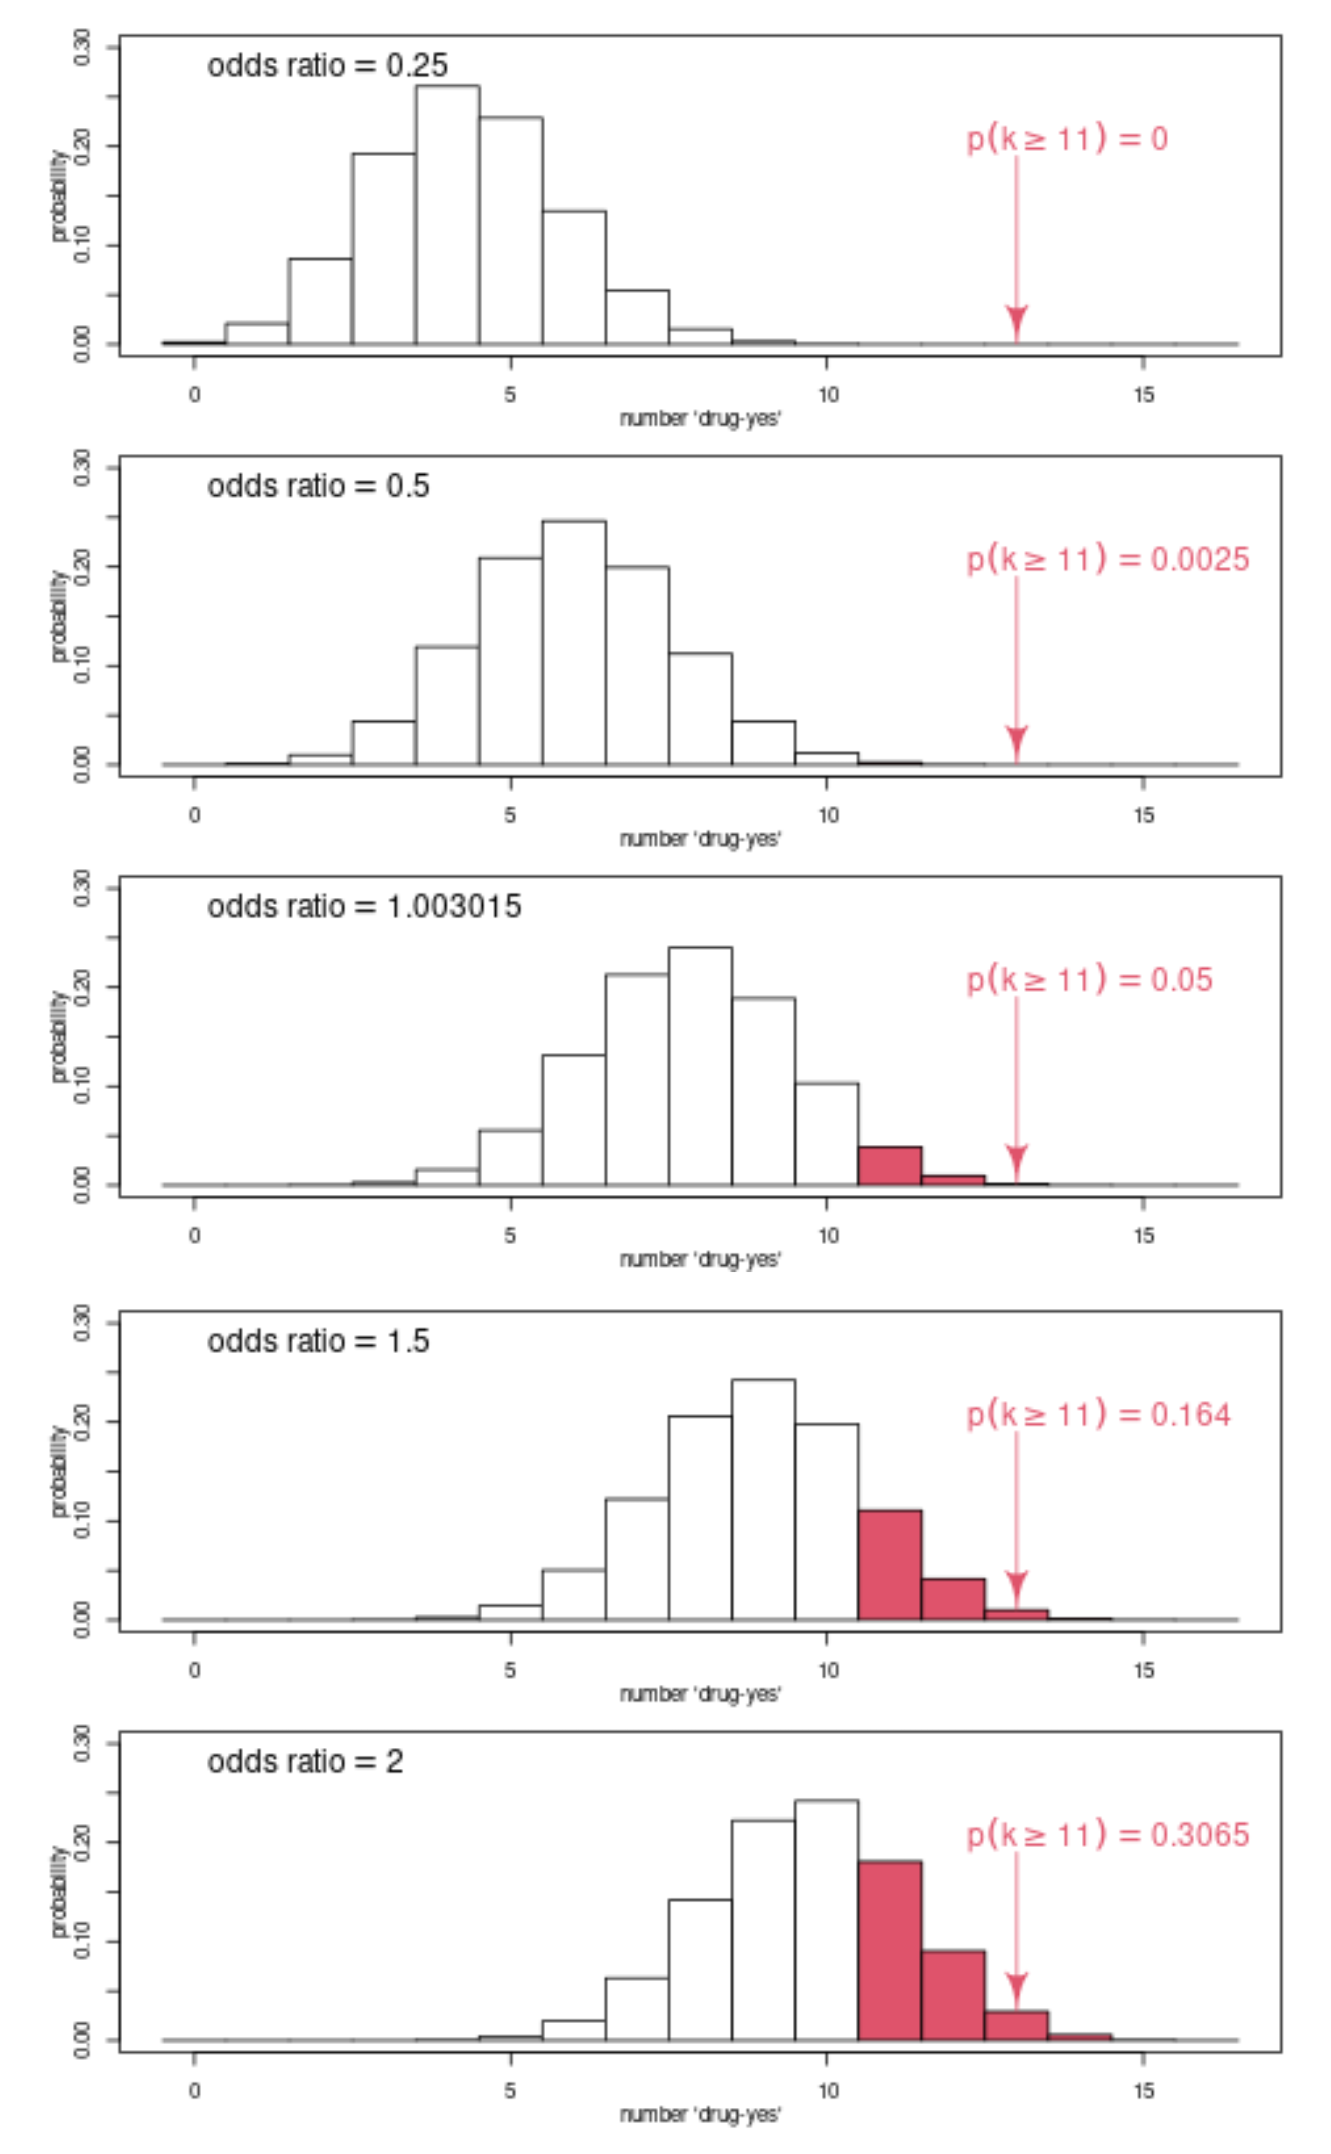
I am having trouble interpreting the upper confidence interval for the odds ratio (OR) after executing Fisher's exact test in R.
I have the following contingency table which contains the response status of the subjects when given a new drug under study versus placebo:
trial_table <- matrix(c(11,5,12,19),2, 2,
    dimnames=list(c("drug", "placebo"), c("yes","no")))
The following contingency table is then created:
        yes no
drug     11 12
placebo   5 19
I then perform base R Fisher's exact test, the alternative hypothesis being that the drug is superior to placebo.
fisher.test(trial_table, alternative = "g")
I get the following result:
    Fishers Exact Test for Count Data

data:  trial_table
p-value = 0.04949
alternative hypothesis: true odds ratio is greater than 1
95 percent confidence interval:
 1.003015      Inf
sample estimates:
odds ratio
  3.387541
Why isn't there an upper confidence interval?
If, however, a two-sided test is performed, both lower and upper CI are reported.
    Fishers Exact Test for Count Data

data:  trial_table
p-value = 0.06871
alternative hypothesis: true odds ratio is not equal to 1
95 percent confidence interval:
  0.8298963 15.7950746
sample estimates:
odds ratio
  3.387541
Alternatively, I have created a bootstrap distribution for the odds ratio to get the confidence intervals (using the infer package in R), but I am not sure this is a valid approach.
The answer might be quite obvious, but not apparent to me at the moment, so I'd be grateful if someone could enlighten me.

