0
$\begingroup$

How can I compress a time series so that any large % changes are compressed and so that all the values fall within a a specific range?

At the moment, I have built in a rule that caps the change at 0.05 or 0.25 whenever the absolute % change is greater than 0.25 or smaller than 0.05. Then, if the new adjusted result is still greater than my upper limit (0.2) or smaller than my lower limit (0.36), I fix the result at 0.2 or 0.36.

Is there a way I can do this using some kind of transformation function instead? Any resources or suggestions would be much appreciated.

Purpose: This is for a business use case. We want to use KPI A as a proxy for another KPI B that we cannot always track. KPI A is a lot more volatile than KPI B and we therefore want to try and reduce the volatility of KPI A according to our expectations for KPI B. (I appreciate that this is not the most scientific way of doing this but our business wants a quick solution (even if it is hacky).

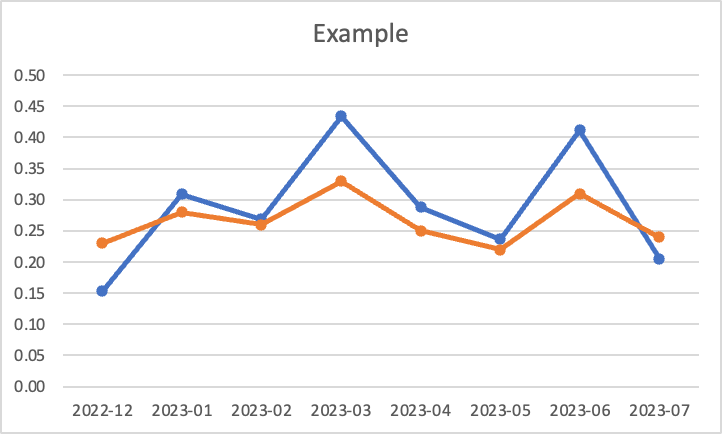
Example: I want the more volatile blue line to look more like the orange line.

enter image description here

$\endgroup$
5
  • $\begingroup$ You can always scale each observation, using the min and the max of the entire series, so the rescaled series is in a specified range. This may, however, increase percentage changes. It might be useful if you could give an example of your input and what you want the output to look like. $\endgroup$ Commented Oct 19, 2023 at 13:43
  • 3
    $\begingroup$ What exactly is your purpose? Why do you want to do this? What is your data? You can always multiply everything by 0 so there is no volatility whatsoever, but I guess you have reasons for not doing this that you are not mentioning. $\endgroup$
    – Tim
    Commented Oct 19, 2023 at 13:44
  • 1
    $\begingroup$ Thank you, your edit makes things much clearer. How about you regress B on A and use the model fit for this regression as a proxy for B? You could in addition model the residuals using some time series forecasting method (the problem here being if you have many missing data points in B). $\endgroup$ Commented Oct 19, 2023 at 13:58
  • $\begingroup$ Thank you very much for your feedback @StephanKolassa! That could be one option. I forgot to mention that as well as wanting the prediction to minimise the difference between the proxy and B, we want to minimise the directional differences between them as well. i.e. when the proxy goes up, B should have gone up as well. This is why I didn't want to rely on a regression only. B in general already captures the directional changes of A quite well, so I was wondering if there was a way of simply compressing the larger changes? $\endgroup$ Commented Oct 19, 2023 at 14:24
  • $\begingroup$ If you do a regression, then at least if A increases, then the fit will also increase. Getting the fit to increase when B increases (even if A decreases) will likely require deeper analysis, and probably more predictors for B than just A. Plus, you now have a multi-criteria problem, because you want to both optimize the fit to B and the "directional fit". This will get problematic, and quite honestly will probably not work well with your task of finding a quick solution. $\endgroup$ Commented Oct 19, 2023 at 15:04

0

Your Answer

By clicking “Post Your Answer”, you agree to our terms of service and acknowledge you have read our privacy policy.

Browse other questions tagged or ask your own question.