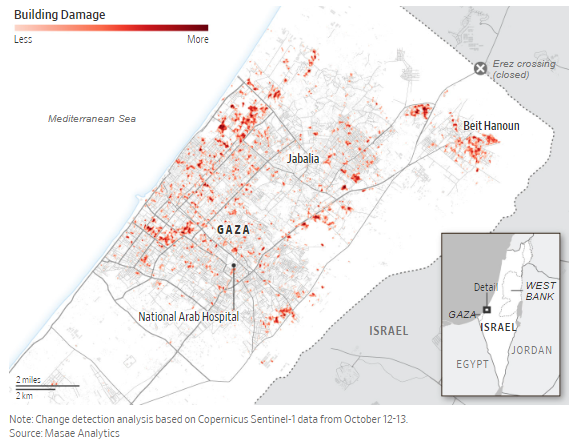
I came across this image on twitter, and it made me think about testing a point process hypothesis. Now this is a politically sensitive image, and I don't want to run afoul of any SE posting guidelines. If anyone has any suggestions on how I can make this question confirm with guidelines, please let me know. The question itself however, is purely a statistical/mathematical question.
So I found this picture below on twitter of a visualization of israeli bomb damage in the current Gaza campaign. Now the source of this data seems to be a private geospatial company, though I don't know the methodologies or models used to collect the data.
However, my question is that this data seems to be pretty random in the sense of a spatial point process. So I want to see if these data points are clustered or if they are more randomly distributed based upon building density.
For a more random process I thought about a negative binomial point process, since this includes counts. However, in looking at the data I don't have actually, but instead a damage level. Hence I might be able to use a poisson process where I code each discretized pixel as either 1/0 for having an event or not. I am not sure if there is a point process for an event occurring matched with a continuous variable for building damage. For the clustered point process I thought of a cox or hawkes process? Now I am only using a Cox/Hawkes process for clustering because I am familiar with them--however if there is a better or simpler model then I am open to suggestions. So I need some help to identify the correct statistical test for my hypothesis, as well as making sure the design is approach is valid.
The tricky point is dealing with the conditional probability. So in the picture, we can see that there are regions with buildings and regions that seem devoid of buildings. Hence I would want to test my hypothesis of a point process over only the regions with bulidings, which means a rather irregular set of boundaries. It has been a while since I worked on spatial point processes--hence I am posting the question--but I believe I would need to discretize the region with buildings, and then apply some poisson probability of an event occurring in that discretized cell. This is easy enough with inverse cdf sampling.
So I would probably use a Bayesian method, meaning that I could define some candidate distributions over the inverse binomial distribution parameters or the cox or hawkes process parameters. Then I would just run MCMC to compare the likelihood of the generated data versus the actual data for both the cox/hawkes model and the negative binomial model.
Now this is where things are a little confusing. So I would have the parameter distribution for both the negative binomial model and the clustered process model, but how would I make the argument that one model is more likely than the other? Is this like one of those Bayes factor type things, or would I use AIC or BIC as a criterion? Or would I just do a simple comparison between the quantiles of the posterior distributions and show which model has the greater probability?
Any suggestions would be appreciated.

