0
$\begingroup$

Here it the link to the GitHub Repository for this project. I am going to preface my question by saying that this problem of interpretation I have run into is in the context of me doing my part as a collaborator on a paper for publication for the first time, and I waited a while before coming here to ask for help on this final conceptual puzzle.

I am responsible for running the 3 benchmark variable selection algorithms on a large set of synthetic datasets, calculating their performance metrics, and analyzing and interpreting them. I am currently interpreting the performance metrics of the 1st benchmark, lasso, and they exhibit two things which don't feel like they should be possible at the same time. They have an extremely high True Positive Rate (aka sensitivity) of 0.867, or equivalently, an extremely low False Positive Rate of 0.133, but simultaneously have a very large number of overall models selected which are categorized as Overspecified (221,269 of the 260,000 total models fit on the 260k synthetic datasets), where by overspecified, I mean they are extraneous variable models, which is a regression equation with all true positives included and at least one false positive as well.

Just to make the problem as clear as possible, here is a screenshot of the Workbook I printed the performance metrics out to from R and store them in: enter image description here
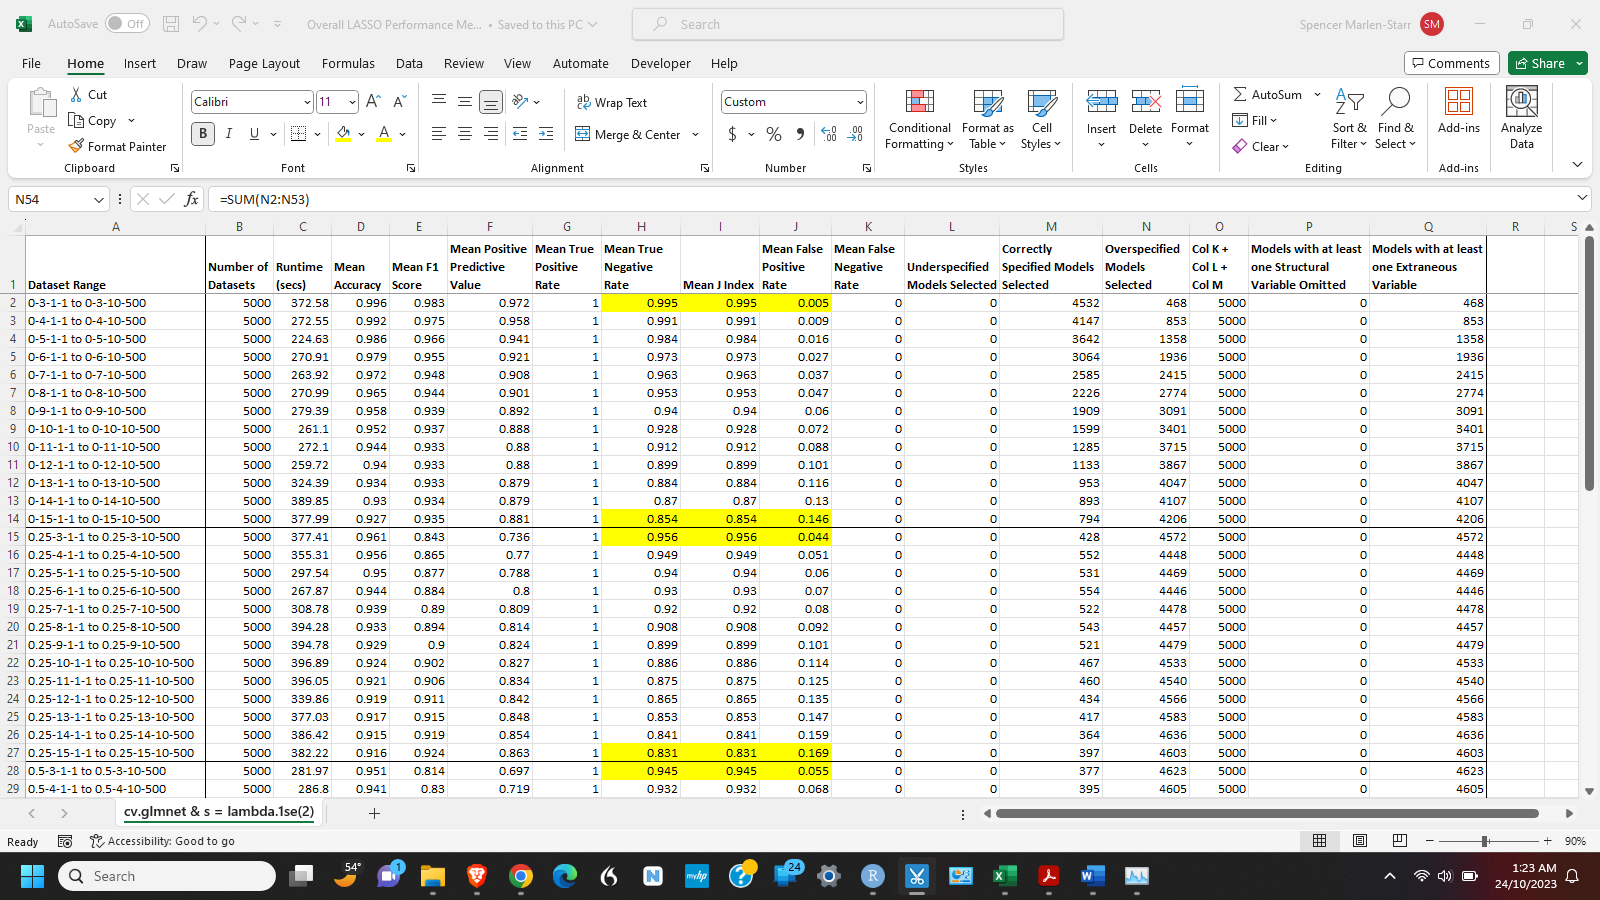
To me, a very high TNR implies a small number of overspecified models by definition, but that's also the way I counted which models are over, under, and correctly specified, by using the TPR, TNR, FPR, and/or FNR I had created as you can see in the following code snippet:

# Number of Underspecified Regression Specifications Selected by LASSO
N_Under = sum( (TPR < 1) & (FPR == 0) )

# Number of Correctly Specified Regressions Selected by LASSO
N_Correct <- sum( (TPR == 1) & (TNR == 1) )

# Overspecified Regression Specifications Selected by LASSO
N_Over = sum( (TPR == 1) & (FPR > 0) )

And the type of relationship I was confident must exist between the TNRs and the number of overspecified models in my performance metrics does in fact exist between the TPRs and the number of underspecified models, i.e. omitted variable models. Because the TPRs are all 1, there are no underspecified models, which is exactly what I would expect.

For the record, when I was writing the R script to run our 1st benchmark (Lasso) that came from and doing the analysis, I asked for help on here or Stack Overflow dozens of times, but never with this part, and I am fully confident I wrote this part of the code correctly, this is a conceptual issue.

$\endgroup$
3
  • $\begingroup$ TPR/FPR and friends are very problematic for all the same reasons as accuracy. Also, they depend heavily on what threshold you are using. Since you do not address this point at all, I suspect you are using a threshold of 0.5, and I would very much encourage you to think about whether this is really what you want. $\endgroup$ Commented Oct 24, 2023 at 8:52
  • $\begingroup$ I agree with you there Stephen, but again, I am just a lowly 2nd author on the 2nd draft of a prior working paper which the lead author wrote by himself. So I don't make the rules around here! Furthermore, I started on this project in July of 2022, and this is the very last step for me right here. $\endgroup$
    – Marlen
    Commented Oct 27, 2023 at 2:22
  • 1
    $\begingroup$ I absolutely understand your position, one more data point on why it makes sense to get the statistician on board before collecting the data (and actually, when designing the study. Unfortunately, I don't have any input on your actual question, I am sorry. Good luck! $\endgroup$ Commented Oct 27, 2023 at 6:28

1 Answer 1

1
$\begingroup$

Based on your related question, your calculations of TPR, TNR, FNR and FPR are done within each model based on the number of predictors known to be "true" or "false" from the construction of the corresponding synthetic data set. All models have 30 total candidate predictors but only between 3 and 15 predictors specified as "true" in each data set (N2 in your data format "N1-N2-N3-N4.csv"). Note that the FPR calculated that way depends on the number of specified "false" predictors, something that you don't seem to be taking into account.

Your definition of an "overspecified" model is just that it includes 1 or more predictors known to be "false" by construction of the data set. To put that in perspective, the 14.6% "false positive rate" for Line 14 of your spreadsheet (15 each "true" and "false" predictors) it equivalent to only about a 1% chance of including any "false" predictor in the model, as: $(1-(1-0.01)^{15} = 0.14)$. It's thus quite possible to have an "overspecified" model on that basis even if the probability of making an error on any one "false" predictor is low.

Furthermore, as you increase the number of true predictors you make it more difficult to avoid keeping an occasional "false" predictor in the final model. That's illustrated in the plots of coefficient values against the L1 norm values in this answer, based on your data. As I said in that answer:

LASSO can't really be expected to find a "true" model, just one that works well enough based on its "bet on sparsity"

Finally, your all-or-none evaluation of predictor presence/absence doesn't do justice to what LASSO is accomplishing with this synthetic data set. At least in the examples I looked at, the coefficient magnitudes of retained "false" predictors tended to be lower than those of the "true" predictors and thus wouldn't much affect any predictions made from those allegedly "overspecified" models. Evaluation of the L1 norms of coefficients of "true" versus "false" predictors retained in the model could give a better sense of how much this "overspecification" might matter in practice.

$\endgroup$
4
  • $\begingroup$ Of course, I knew this was coming from a simple conceptual error on my part! Thank you so much for the clarification here. If there is a 15 factor model for a given dataset, a really low FPR for each individual variable selected of them does not automatically imply that most of the overall models selected will have exactly 0 false positives in them! $\endgroup$
    – Marlen
    Commented Oct 30, 2023 at 18:27
  • $\begingroup$ I have read all of your previous replies, most of them multiple times. But I think I got a fraudulent master's degree in data analytics, because I still really struggle across the board with all aspects of data analytics and data science despite trying my best. $\endgroup$
    – Marlen
    Commented Nov 3, 2023 at 13:44
  • 1
    $\begingroup$ @Marlen a master's degree can't make you an expert in all aspects of data science. At best, it might help you learn how to learn what you need to when you are faced with a new data-analysis situation. To help re-build your confidence, I'd suggest working through all of An Introduction to Statistical Learning over time. I suspect that you will find that what you learned during your master's program will provide valuable support through that process, even for types of analyses that you might not have encountered during your studies or work to date. $\endgroup$
    – EdM
    Commented Nov 3, 2023 at 16:40
  • $\begingroup$ That's the textbook we used in my STAT 515 (basically into to statistical learning) course. I actually preferred the textbook we used in my Applied Predictive Analytics class, it has the same name and it from 2013. Only 1 edition. I have re-read through most of both of them over the last 12 months. But my memory is TERRRIBLE. I have a real hard time remembering them or anything else I learn to be honest. $\endgroup$
    – Marlen
    Commented Nov 6, 2023 at 18:42

Your Answer

By clicking “Post Your Answer”, you agree to our terms of service and acknowledge you have read our privacy policy.

Not the answer you're looking for? Browse other questions tagged or ask your own question.