2
$\begingroup$

I am curious about the sign of $corr(y, \hat{y})$ with and without intercept.

I recall reading that when there is an intercept, the correlation is $\geq 0$, but in the case without intercept, the correlation can also be negative. From a geometric perspective, I don't see how this can be.

Regardless of whether there is an intercept, $\hat{y}$ is the orthogonal projection of $y$ onto the subspace spanned by the predictors. So shouldn't that orthogonal projection point in the same direction as $y$, in which case the correlation should be $\geq 0$ regardless of whether there is intercept or not?

Mathematically, I tried to prove this, and it seems to match my geometric intuition.

$$ \hat{y} = \hat{\beta}_{1} x + \hat{\beta}_0 \\ corr(y, \hat{y}) = corr(y, \hat{\beta}_{1} x + \hat{\beta}_0) \\ = corr(y, \hat{\beta}_{1} x) \\ = sgn(\hat{\beta}_{1}) corr(y, x) \\ $$ I believe $sgn(\hat{\beta}_{1})$ is the same as $sgn(corr(y, x))$, so the above quantity is always $\geq 0$. So we proved that $corr(y, \hat{y})$ is non-negative in the case with intercept; however, I believe this derivation also holds for the case without intercept, since $\hat{\beta}_0$ isn't really used in this derivation?

Edit: What I also want to add is, I know that when you remove the intercept, it's possible that the sign ($sgn(\hat{\beta}_{1})$) of the slope can flip; however, if the sign of the slop is flipped, doesn't the sign of $corr(y, x)$ also flip?

$\endgroup$
6
  • 3
    $\begingroup$ Consider data in the first quadrant which slopes down. A line through the origin will have positive slope and so be negatively correlated with y. $\endgroup$
    – Glen_b
    Commented Nov 26, 2023 at 2:29
  • $\begingroup$ @Glen_b I see. It seems I am mistakingly thinking that $sgn(\hat{\beta}_1) = sgn(corr(y, x))$, which may only apply in the case of with an intercept? $\endgroup$
    – roulette01
    Commented Nov 26, 2023 at 2:32
  • $\begingroup$ Certainly it's true for the ordinary least squares line with two parameters, but clearly it's not certain to be true for every other kind of line. A simple example to ponder would be the case with points (0.4,0..6), (0.6,0.4). The usual least squares line (and indeed most other estimators of linear fits in common use that have two free parameters) has slope -1, but the least squares line through the origin has slope a little above 0.9; the two correlations between $y$ and $\hat{y}$ for those fits are 1 and -1 respectively. $\endgroup$
    – Glen_b
    Commented Nov 26, 2023 at 2:57
  • $\begingroup$ @Glen_b makes sense. just to clarify, when you say "two parameters" are you referring to the 2 coeffiicients (slope and intercept) in the case of simple linear regression? $\endgroup$
    – roulette01
    Commented Nov 26, 2023 at 2:58
  • 1
    $\begingroup$ Yes. ... When thinking about what happens in some circumstance I find it very useful to draw pictures, to make up data (computers make this task much easier, since you can simulate data sets of various sizes and characteristics quickly), and most importantly, to try to break my intuition. People's intuition often leads them astray with statistics, and if we don't try to break what our flawed 'intuition' tells us, we very often end up just confirming our own biases by only considering cases that comport with them. $\endgroup$
    – Glen_b
    Commented Nov 26, 2023 at 3:00

1 Answer 1

2
$\begingroup$

For simple linear regression (with an intercept) you have $\hat \beta_1=\frac{\sum (x_i-\bar x)(y_i-\bar y)}{\sum (x_i-\bar x)^2}=\frac{s_y}{s_x}r_{x,y}$ and, since $s_x >0$ and $s_y > 0$, this forces the slope $\hat \beta_1$ and correlation $r_{x,y}$ to have the same sign.

Without an intercept, you have $\hat \beta_1=\frac{\sum x_iy_i}{\sum x_i^2}$, which forces $\hat \beta_1$ to have the same sign as $\sum x_iy_i$. This need not have the same sign as $r_{x,y}$.

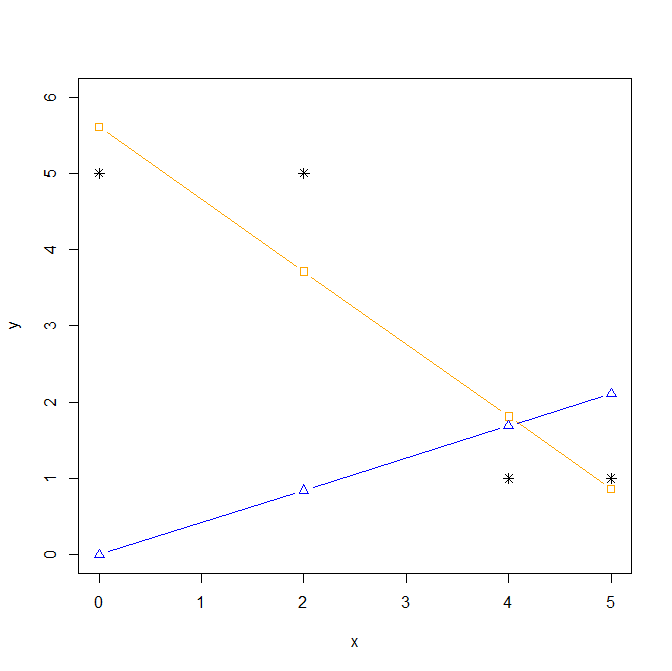
As @Glen_b commented, consider data in the first quadrant: this will inevitably have $\sum x_iy_i >0 $ and so without an intercept $\hat \beta_1 >0$ whether $r_{x,y}$ is positive or negative. As an illustration, consider the points $(0,5)$, $(2,5)$, $(4,1)$ and $(5,1)$ illustrated in black below. A fitted line with an intercept (orange) will slope in the same general direction and the fitted values have a positive correlation with the original data, while a fitted line forced through the origin (blue) need not.

enter image description here

$\endgroup$

Your Answer

By clicking “Post Your Answer”, you agree to our terms of service and acknowledge you have read our privacy policy.

Not the answer you're looking for? Browse other questions tagged or ask your own question.