2
$\begingroup$

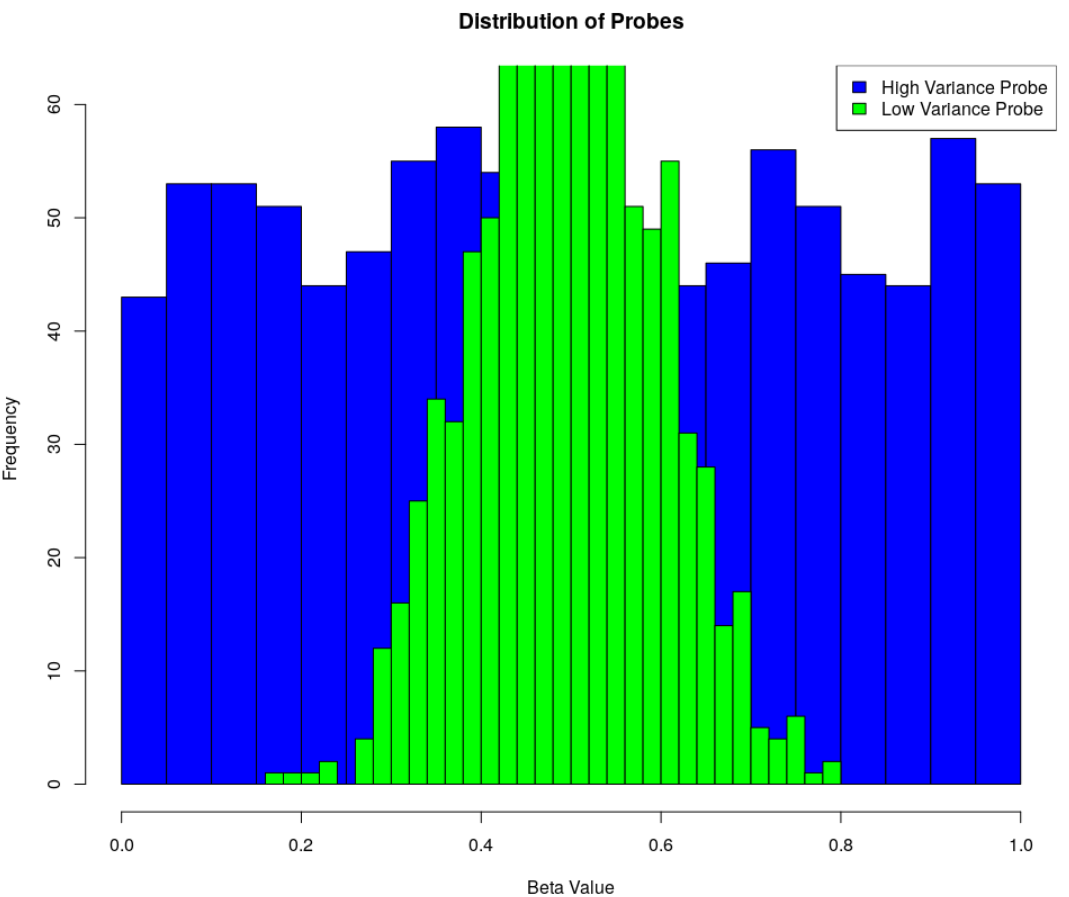
Hi I'm perplexed because I assume that a distribution with higher variance should have higher entropy scores, however this does not appear to be the case? Here is an example.

# Set seed for reproducibility
set.seed(0)

# High Variance Probe: Uniform distribution
high_variance_probe <- runif(1000, min = 0, max = 1)

# Low Variance Probe: Normal distribution, but tightly clustered
mean <- 0.5
std_dev <- 0.1
low_variance_probe <- rnorm(1000, mean = mean, sd = std_dev)
low_variance_probe <- pmin(pmax(low_variance_probe, 0), 1) # Clipping values to [0, 1]

entropy::entropy (high_variance_probe)
entropy::entropy (low_variance_probe)

high variance is: 6.717094 low variable_probe is: 6.886953

why is this the case? enter image description here

$\endgroup$

1 Answer 1

5
$\begingroup$

I see at least two explanations:

  1. Shannon entropy is defined for discrete random variables. The extension to the continuous case is called differential entropy, though its interpretation is less straightforward and arguably less meaningful or useful, see for example here and here.

  2. The entropy::entropy function only calculates Shannon entropy (discrete case) and is coded to accept counts per bin, that is, you have to pre-summarize your data. Consider the following code example:

set.seed(1)
## Low variance discrete variable
low <- sample(1:5, size=1E5, replace=TRUE, prob=c(1,1,10,1,1))
## High variance discrete variable
high <- sample(1:5, size=1E5, replace=TRUE)

## Incorrect usage
entropy::entropy(low)
> 11.47
entropy::entropy(high)
> 11.39

## Correct usage
entropy::entropy(table(low))
> 0.9953
entropy::entropy(table(high))
> 1.6094
$\endgroup$
1
  • $\begingroup$ I see now, thank you. $\endgroup$
    – Alex
    Commented Dec 6, 2023 at 17:06

Your Answer

By clicking “Post Your Answer”, you agree to our terms of service and acknowledge you have read our privacy policy.

Not the answer you're looking for? Browse other questions tagged or ask your own question.