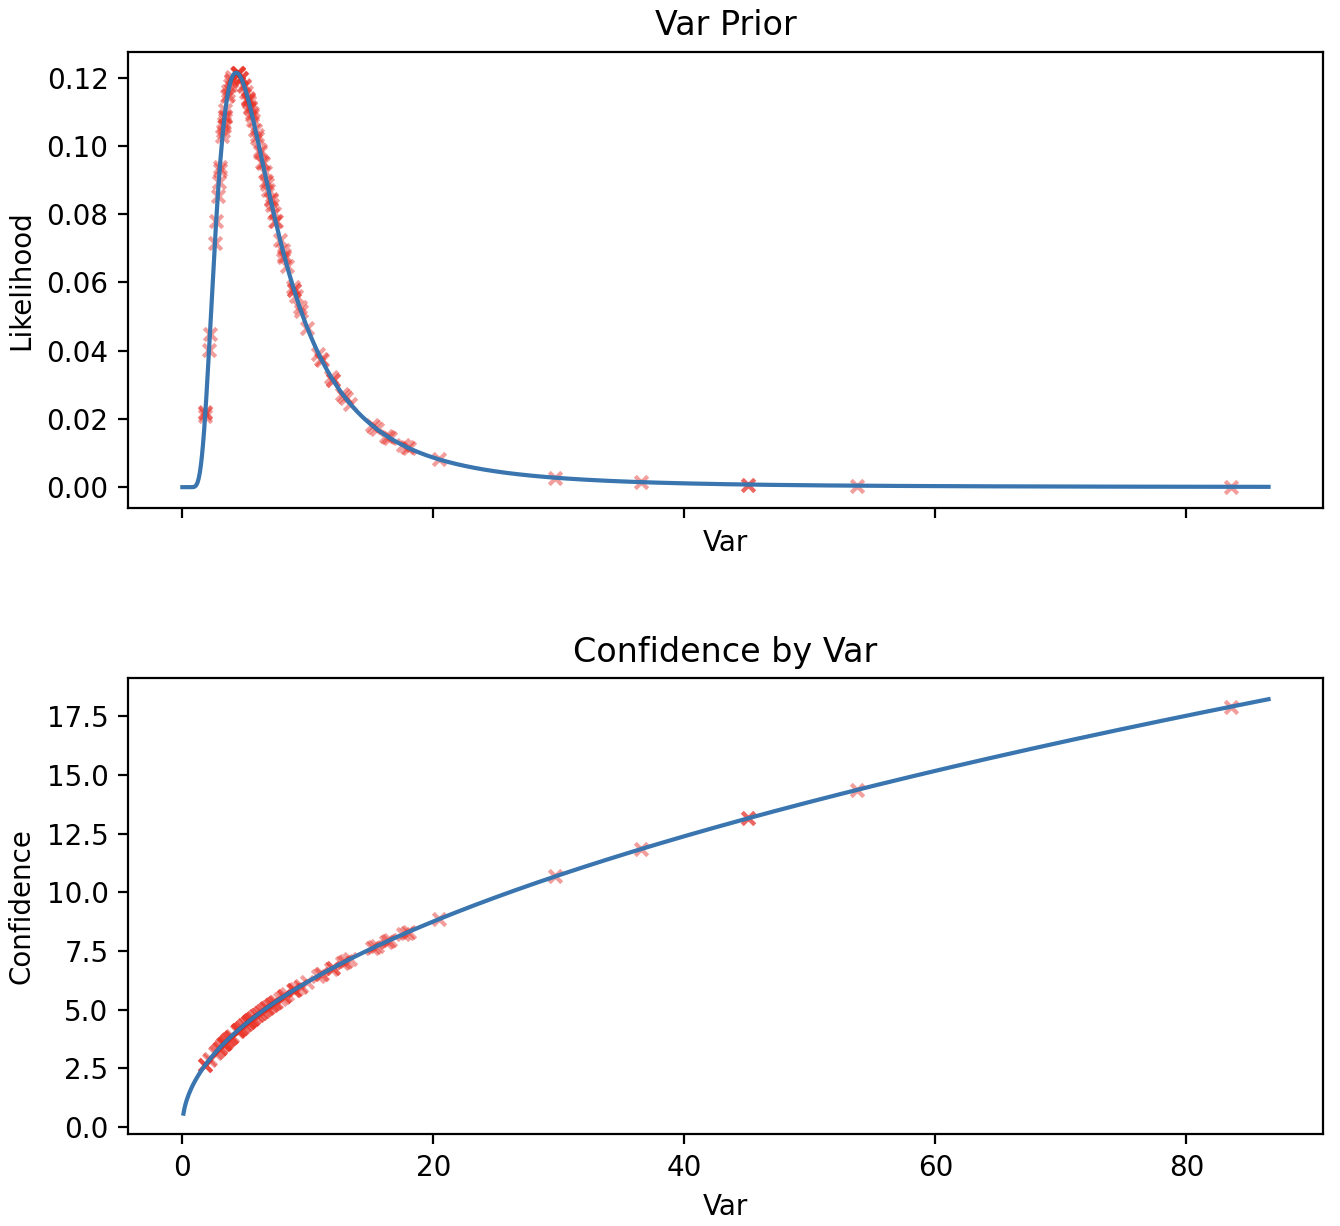
Suppose:
\begin{equation} x|\sigma^2 \sim \mathcal{N}(x; \mu, \sigma^2) \; \; st. \; \; \sigma^2 \sim \mathcal{X}^{-2}(\sigma^2; \psi, v) \end{equation}
where $\mathcal{X}^{-2}$ is the inverse chisquared distribution with degrees of with scale parameter $\psi$ and degrees of freedom $v$.
It is known that the marginal distribution of $x$ can be calculated as follos:
\begin{equation} \begin{aligned} p(x) &= \int p(x|\sigma^2)p(\sigma^2)\; d\sigma^2 \\ &= \int \mathcal{N}(x; \mu, \sigma^2)\mathcal{X}^{-2}(\sigma^2; \psi, v) \; d\sigma^2 \\ &= \mathcal{T}(x; \psi, v) \end{aligned} \end{equation}
Where $\mathcal{T}$ is the student $t$-distribution with scale parameter $\psi$ and degrees of freedom $v$. From here, the confidence interval can be calculated directly from the $t$-distribution.
I would like to show that Montecarlo methods can also be used to approxmate the confidence interval of $x$. However, surprisingly the average of confidences does not match.
I am approximating the 97.5% confidence as follows:
- Sample 1,000 variances from $\mathcal{X}^{-2}(\sigma^2; \psi, v)$
- Compute the 97.5% confidence of a normal using each sampled variance.
- Average the resulting confidence.
I am essentially averaging the y-values of the bottom chart.

As mentioned the average obtained in step-3 does not match the 97.5% confidence of $\mathcal{T}(x; \psi, v)$.
Are there any suggestions as to how to approximate the 97.5% confidence using sampling methods?
