The Dangers of P-Value Hunts
Peter already noted issues in your interpretation that I completely agree with (see my answer here, here, or here, which all show how meaningless $p$ values can become without understanding the effect sizes or the functional relationships of the variables we are estimating). Rather than state the case here like I normally do, I'll share a story the damage of such thinking from Hauer (2007):
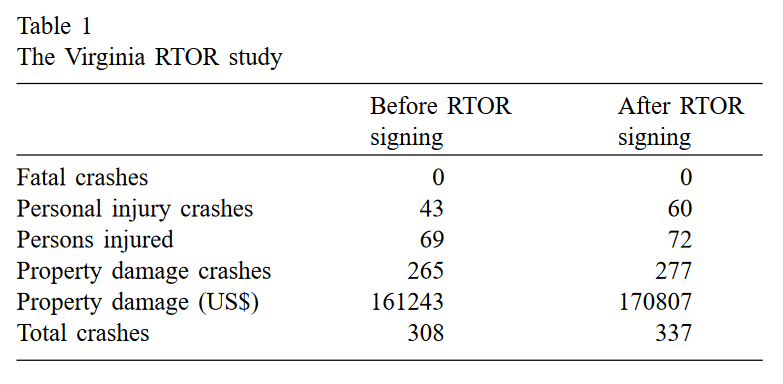
Our story begins in 1976 when a consultant submitted a report about the safety repercussions of RTOR (Right Turn on Red) to the Governor and General Assembly of Virginia. The studies then extant were deemed deficient and the consultant did his own before–after study at 20 intersections with the results in Table 1.

Looking at the data in Table 1, persons without training in statistics would think that after RTOR was allowed, these intersections were somewhat less safe. However, the consultant concluded, quite correctly, that the change was not statistically significant. The Commissioner of the Virginia Department of Highways and Transportation sent the consultant’s report to the Governor and in the letter of transmittal wrote: “we can discern no significant hazard to motorists or pedestrians from implementation of the general permissive rule (i.e. of RTOR). No significant increase in traffic crashes has been noted following adoption of right-turn-on-red in any state including Virginia”...
More published studies followed. One study in 1977 found that there were 19 crashes involving right turning vehicles before and 24 after allowing RTOR and “this increase in accidents in not statistically significant, and therefore it cannot be said that this increase in RTOR accidents is attributable to RTOR”. And so the sequence of small studies all pointing in the same direction but with statistically not significant results continued to accumulate, till that last study which I followed was published in 1983. While 287 crashes to right turning vehicles were expected, 313 were counted. The authors concluded, once again, that there was no significant difference in vehicular crashes.
In the 1980s, researchers finally looked at the total years of accumulated evidence rather than single studies and uncovered the unflattering truth (Preusser, 1982):
Estimates of the magnitude of the increases ranged from 43% to 107% for pedestrian accidents and 72% to 123% for bicyclist accidents.
The wholescale adoption of this procedure, completely based off statistical significance, literally killed a large percentage of the population that didn't have to die.
Thoughts
Please inspect the data visually, find out the mean differences and their standard errors / confidence intervals, and determine what the data actually says about your groups. As a reminder, a $p$ value is just a probability of a given estimate (or more extreme) given the null hypothesis is true (Wasserstein & Lazar, 2016). One can neither accept the null nor the alternative hypothesis from a low $p$ value, nor can they ascertain what the magnitude of the effect is from a $p$ value alone. So as Peter noted, please do some more digging.
- Hauer, E. (2004). The harm done by tests of significance. Accident Analysis & Prevention, 36(3), 495–500. https://doi.org/10.1016/S0001-4575(03)00036-8
- Preusser, D.F., Leaf, W.A., DeBartdo, K.B., Blomberg, R.D., Leoy, M.M., 1982. The effect of right-turn-on-red on pedestrian and bicycle accidents. J. Safety Res. 13, 45–55.
- Wasserstein, R. L., & Lazar, N. A. (2016). The ASA statement on p-values: Context, process, and purpose. The American Statistician, 70(2), 129–133. https://doi.org/10.1080/00031305.2016.1154108

