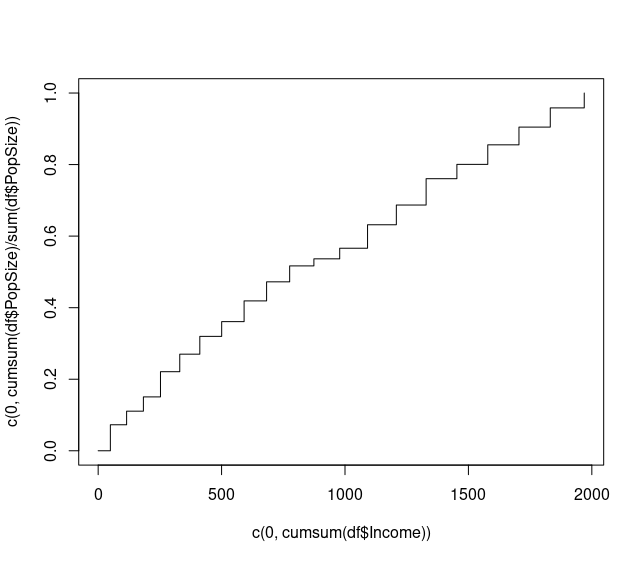
I have census tract data where each row holds the population size and a variable value (e.g., income). I want to plot the cumulative distribution function (CDF) of the TRUE population, i.e., accounting for the population size in each tract. So if my data has ~3000 census tracts, the entire population is ~ 8 milion.
I tried converting the data to a long form, but the result is a very large DF that is hard to plot and analyse (my real data have ten years of data, so it creates a DF with 80 milion rows).
Here is a sample data and the long form version I tried:
df = data.frame(PopSize = rnorm(20,1000,300),
                Income  = rnorm(20,100,30))
df_long = df[rep(seq_len(nrow(df)), times=df$PopSize),]
This converts the 20 rows with a sample size of ~1000 in each, to a DF with ~20,000 rows, making it impracticle to work with in my real data of ~8 milion.
Is there a way to create a CDF plot that will account for tha sample size in each row? Thanks

