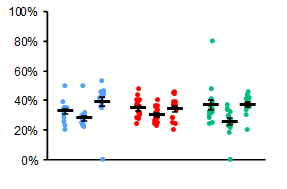
What would be a good test to compare patterns of differences among treatments? For example, the Y maze has an outcome of % of entries into each of three arms. Thus, three numbers are generated for each trial. Suppose two groups of animals are treated, and we are interested in how the pattern among the three arms changes by treatment. That is, we aren't interested in A vs. A for treated vs. untreated. Instead, we want to test if the composite %A/%B/%C as a profile for untreated differs from %A/%B/%C as a profile for treated. The outcomes are constrained in that %A + %B + %C must equal 100% for each animal within each group.
There are three groups of animals. WT, Tg, and Tg + Drug (this is data dumped on my lap, I didn't get to design the experiment). Each animal is put through a Y maze once. The selections of and time spent in each of three arms is recorded. This generates counts and seconds as data, three counts and three time sums for each animal. It is conventional in the field to convert selections and times into percents of total selections, etc. I provide a CSV of a truncation of the data:
Animal,Treatment,Arm,Entries,PercEnt
1,W,A,10,0.344827586
1,W,B,7,0.24137931
1,W,C,12,0.413793103
2,W,A,6,0.333333333
2,W,B,4,0.222222222
2,W,C,8,0.444444444
3,W,A,6,0.352941176
3,W,B,4,0.235294118
3,W,C,7,0.411764706
4,W,A,5,0.227272727
4,W,B,7,0.318181818
4,W,C,10,0.454545455
5,Y,A,10,0.357142857
5,Y,B,7,0.25
5,Y,C,11,0.392857143
6,Y,A,14,0.368421053
6,Y,B,10,0.263157895
6,Y,C,14,0.368421053
7,Y,A,9,0.3
7,Y,B,10,0.333333333
7,Y,C,11,0.366666667
8,Y,A,12,0.285714286
8,Y,B,15,0.357142857
8,Y,C,15,0.357142857
9,X,A,8,0.32
9,X,B,6,0.24
9,X,C,11,0.44
10,X,A,4,0.8
10,X,B,0,0
10,X,C,1,0.2
11,X,A,11,0.323529412
11,X,B,10,0.294117647
11,X,C,13,0.382352941
12,X,A,6,0.25
12,X,B,8,0.333333333
12,X,C,10,0.416666667
So, the outcomes derived (due to constraints of field conventions) is "PercEnt". The treatments are W, X, Y. The arms from which the animals make a choice are A, B, C. Each animal goes through this process once. The outcome of interest is how the relationship of A/B/C among themselves differs by treatment.
Here is a plot of the full data set:
So, what I want to do is formally infer if the patterns of A/B/C levels as a whole differ by treatment. It's basically "high/low/high" for each, but the extent of "high/low/high" as a whole isn't identical among treatments. Is that difference significant?
I hope this is sufficiently clear.

